View methods side by side.
Choose up to four methods. Add them using the search and share the comparison by copying its link.
| Criterion |  Operations Scatter Diagram |  Decision Making Eisenhower Matrix | 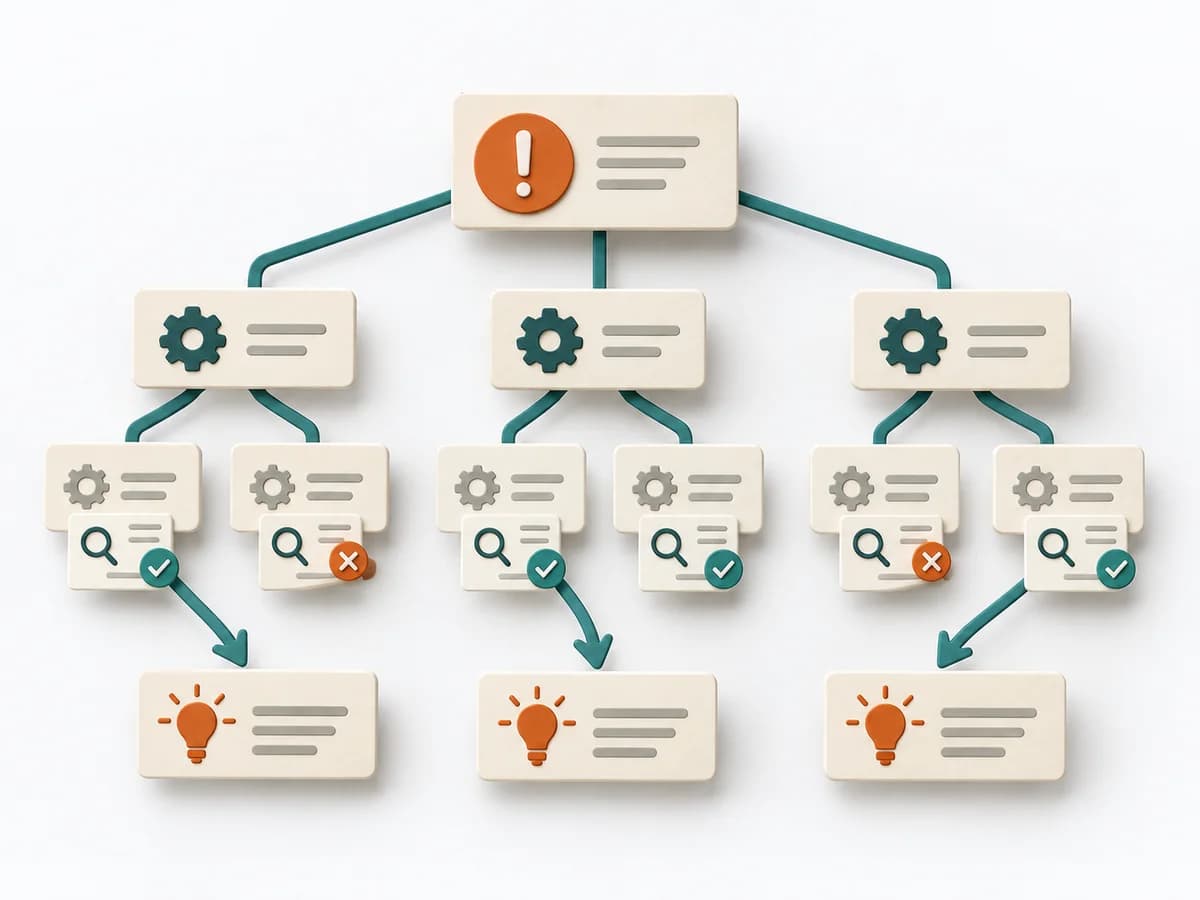 Operations Root Cause Tree Analysis |  Operations 8D Problem Solving |
|---|---|---|---|---|
Purposedifferent | When the question is whether two measures are related, the method makes patterns in the data picture visible. It separates felt correlations from relationships that actually show up in the data. | It separates true priorities from noise so it becomes clear what should be done now, scheduled, delegated, or dropped. | For a problem with several suspected causes, the method builds a causal structure instead of a mere list. It makes visible how causes connect and where the strongest points of leverage lie. | For an acute quality or delivery problem, the method structures immediate protection and root cause work together. It keeps the situation stable while the actual cause is investigated cleanly. |
Complexitydifferent | Low | Low | Medium | High |
Timedifferent | 30-90 min | 15-30 min | 1-3 h | 1-6 Wochen |
Participantsdifferent | 1-4 | 1-6 | 2-8 | 4-10 |
Formatdifferent | Workshop + async | Workshop + async | Workshop | Workshop + async |
Outputdifferent | Scatter Plot, Korrelationsnotiz, Hypothesenliste | Eisenhower Matrix, Action List, Delegation Notes | Cause Tree, Evidence Notes, Countermeasures | 8D Report, Containment Plan, Root Cause Evidence, Corrective Action Plan |
Tagsno overlap | Root causeQualityVisualization | PrioritizationFocusTasks | Root causeTreeIncidentQuality | QualityProblem solvingRoot cause |