View methods side by side.
Choose up to four methods. Add them using the search and share the comparison by copying its link.
| Criterion | 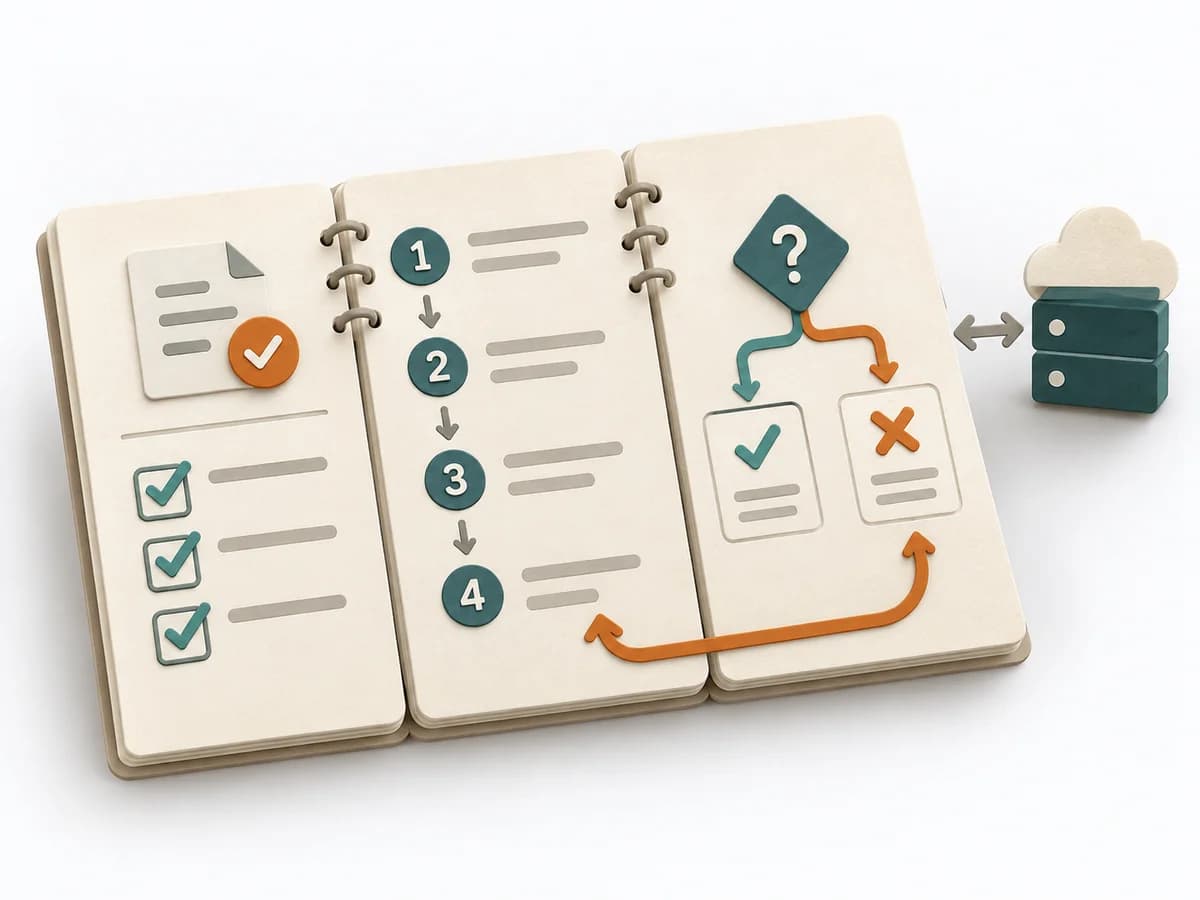 Operations Runbook | 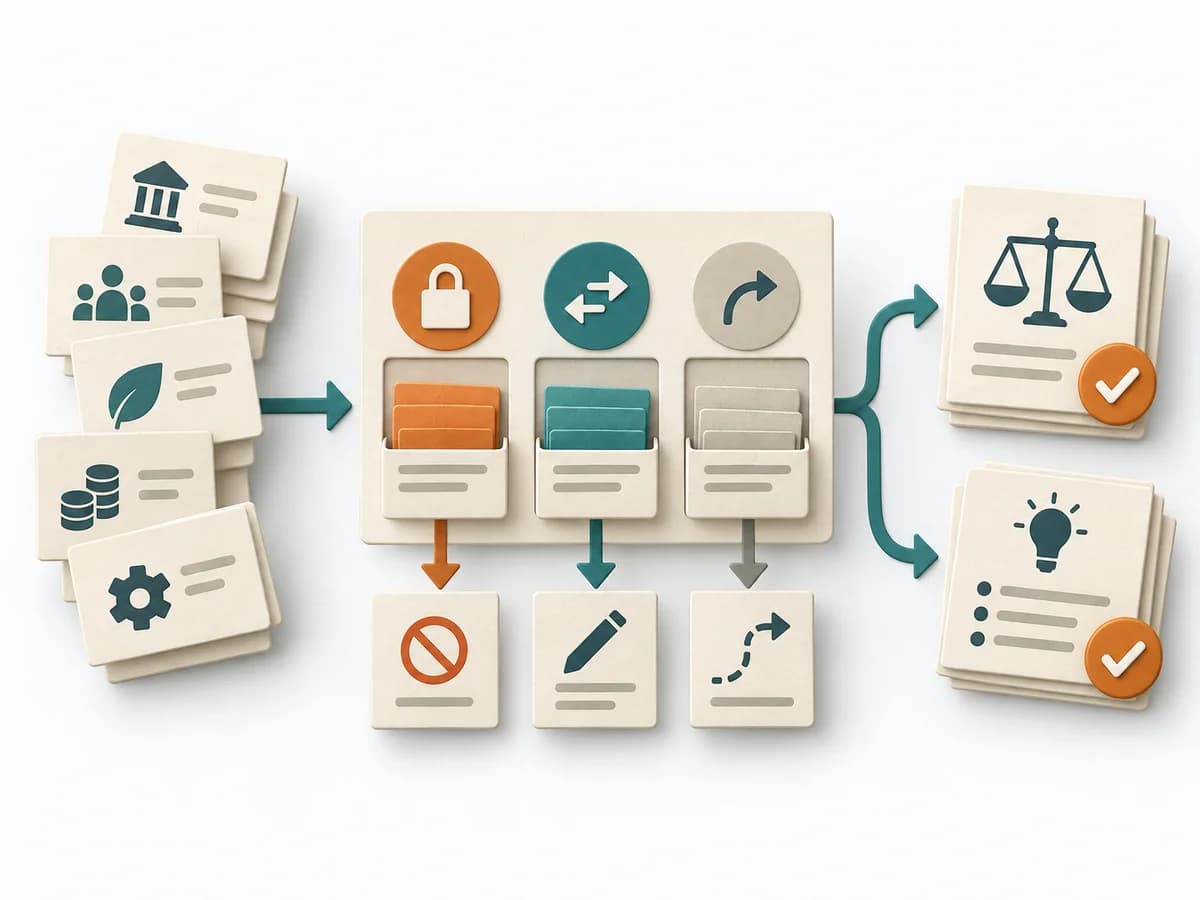 Decision Making Constraint Analysis |  Operations Failure Mode and Effects Analysis |  Operations Fishbone Diagram |
|---|---|---|---|---|
Purposedifferent | For recurring operational tasks or incidents, the method keeps solid action logic ready. It reduces uncertainty when time pressure, role changes, or rare situations demand fast access. | When an initiative stalls, the limit often lies not in the idea but in hard or soft boundary conditions. Constraint Analysis separates these limits and shows which of them can actually be shaped. | For a process, product, or service with noticeable failure risks, the method assesses possible failure modes in advance. It directs attention to combinations of occurrence, effect, and detectability. | When a problem has several possible contributing factors, the method sorts causes by cause areas. It prevents an initial hunch from blocking the view of other plausible drivers. |
Complexitydifferent | Low | Low | High | Low |
Timedifferent | 20-60 min | 30-90 min | 2-6 h | 30-60 min |
Participantsdifferent | 1-4 | 2-8 | 3-10 | 2-8 |
Formatdifferent | Async | Workshop + async | Workshop | Workshop |
Outputdifferent | Runbook, Checklist, Escalation Path | Constraint List, Hard/Soft Classification, Option Impact Notes, Decision Boundaries | FMEA Table, Risk Priority, Mitigation Actions | Fishbone Diagram, Cause Categories, Investigation Backlog |
Tagsno overlap | OperationsReliabilityDocumentation | ConstraintsDecisionPlanningOptions | RiskQualityOperationsRoot cause | Root causeQualityOperations |