View methods side by side.
Choose up to four methods. Add them using the search and share the comparison by copying its link.
| Criterion | 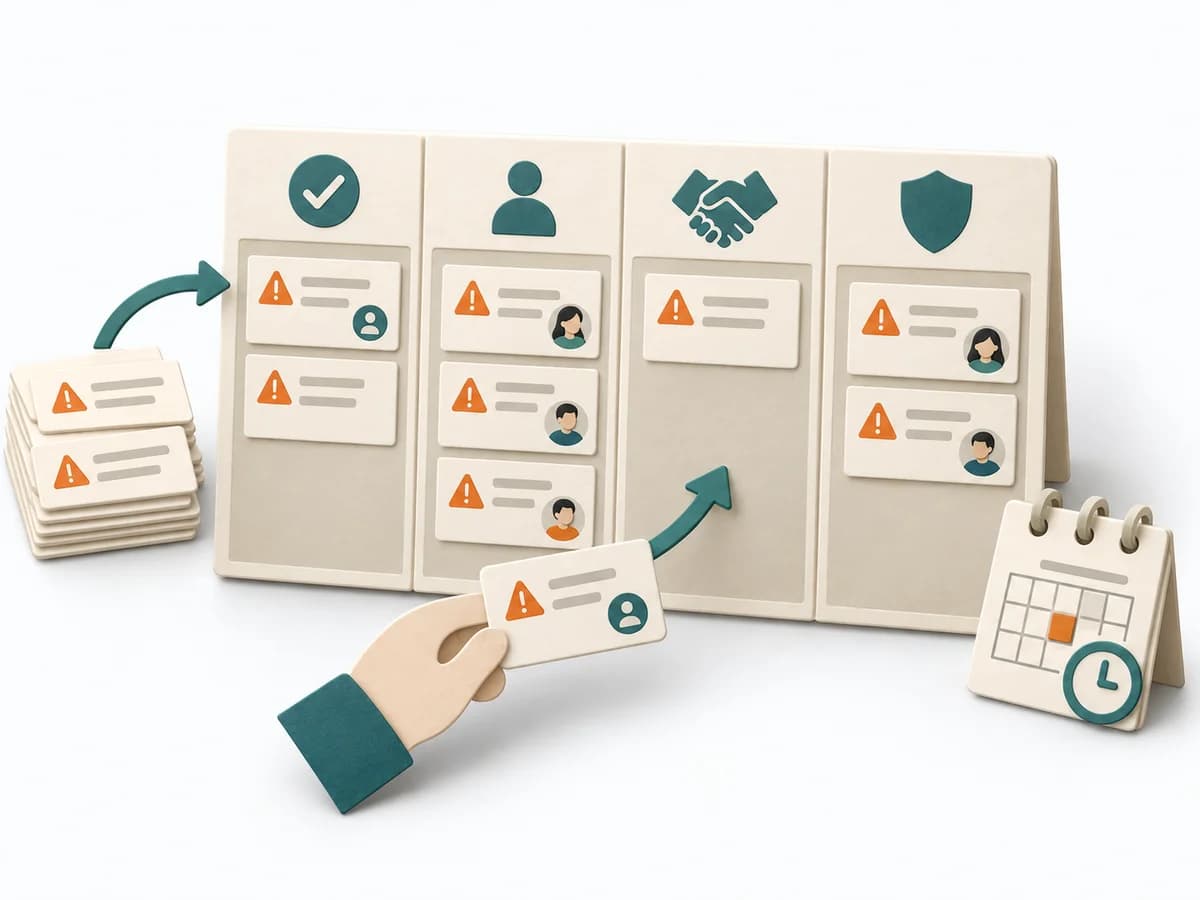 Agile ROAM Board | 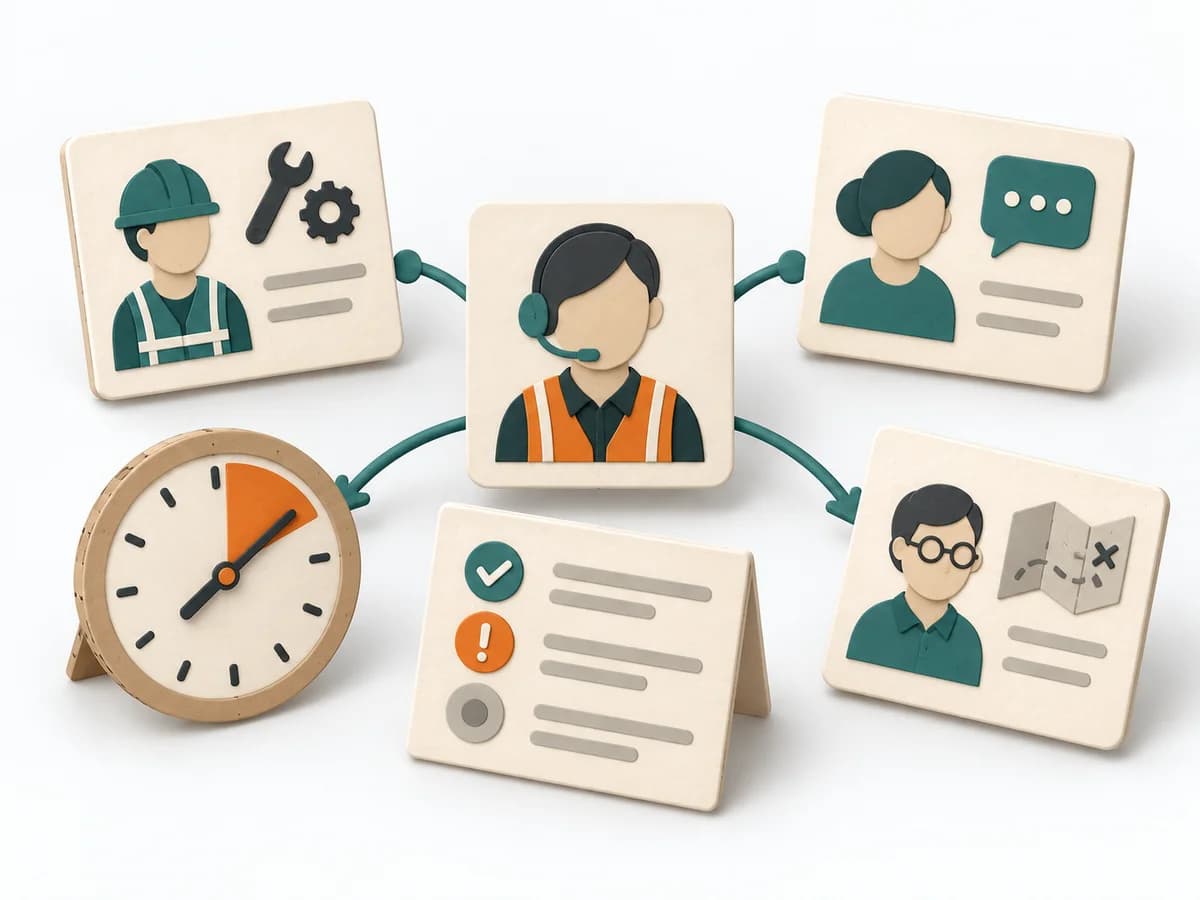 DevOps Incident Command |  Operations Root Cause Analysis |  Operations Fishbone Diagram |
|---|---|---|---|---|
Purposedifferent | When work needs to move between different states or columns, it makes that movement and its handoffs legible. It sorts work by value, risk, and delivery ability. The result is captured as a ROAM Board and an Owner List. | During an acute incident with several people involved, the method creates a clear leadership and communication structure. It reduces chaos when fast coordination and clean situational awareness are both needed at once. | When a problem keeps recurring and the cause stays unclear, the method exposes the underlying mechanism. It separates symptom, guess, and robust explanation from one another. | When a problem has several possible contributing factors, the method sorts causes by cause areas. It prevents an initial hunch from blocking the view of other plausible drivers. |
Complexitydifferent | Low | Medium | Medium | Low |
Timedifferent | 20-40 min initial, dann laufend | As needed | 1-4 h | 30-60 min |
Participantsdifferent | 3-15 | 4-15 | 3-8 | 2-8 |
Formatdifferent | Workshop + async | Workshop + async | Workshop + async | Workshop |
Outputdifferent | ROAM Board, Owner List | Incident Log, Action Tracker, Stakeholder Updates | Problem Statement, Cause Hypotheses, Confirmed Causes, Action Plan | Fishbone Diagram, Cause Categories, Investigation Backlog |
Tagsno overlap | RiskAgileTrackingAlignment | IncidentOperationsReliability | Root causeProblem solvingQualityIncident | Root causeQualityOperations |