View methods side by side.
Choose up to four methods. Add them using the search and share the comparison by copying its link.
| Criterion |  Product Strategy RICE Scoring |  Agile WSJF | 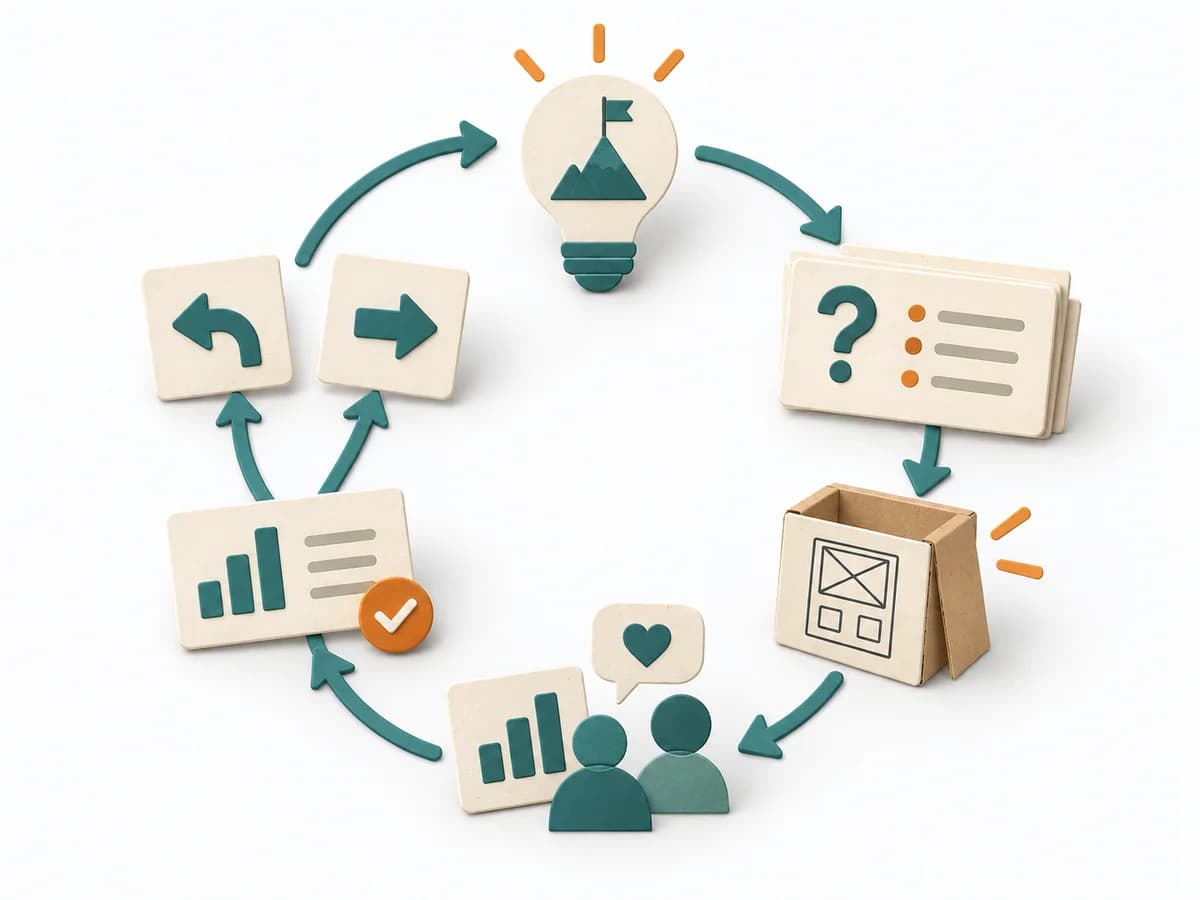 Innovation Lean Startup |  Delivery Cost of Delay |
|---|---|---|---|---|
Purposedifferent | When many initiatives compete for the same resources, it brings reach, impact, confidence, and effort into one shared ranking. It makes prioritization economically connectable. | When many tasks compete for the same capacity, it orders work by economic impact. It makes time lost, benefit, and effort comparable together. | For uncertain business assumptions, the method forces the idea into contact with real market reactions early. It separates wishful picture, assumption, and observable behavior, so that learning becomes faster than planning. This translates uncertainty into measurable insight. | Helps clarify scope, order, and delivery flow in concrete terms. It makes work, constraints, and sequence manageable. The result is captured as a Cost of Delay table and prioritization sequence. |
Complexitydifferent | Medium | High | Medium | High |
Timedifferent | 60-90 min | 45-90 min | Wochen bis Monate je Lernzyklus | 90-180 min |
Participantsdifferent | 2-10 | 3-10 | 2-8 | 3-8 |
Formatdifferent | Workshop + async | Workshop | Workshop + async | Workshop |
Outputdifferent | RICE Scores, Ranked List, Assumption Log | Ranked Backlog, Cost-of-Delay Assumptions | Hypothesis list, MVPs, Learning reports, Pivot or persevere decision | CoD Table, Prioritization Sequence |
Tagsno overlap | PrioritizationScoringRoadmapTradeoffs | LeanEconomicsSequencePrioritization | LeanStartupValidationMVP | PrioritizationDeliveryEconomicsDecision |