View methods side by side.
Choose up to four methods. Add them using the search and share the comparison by copying its link.
| Criterion |  Decision Making Radar | 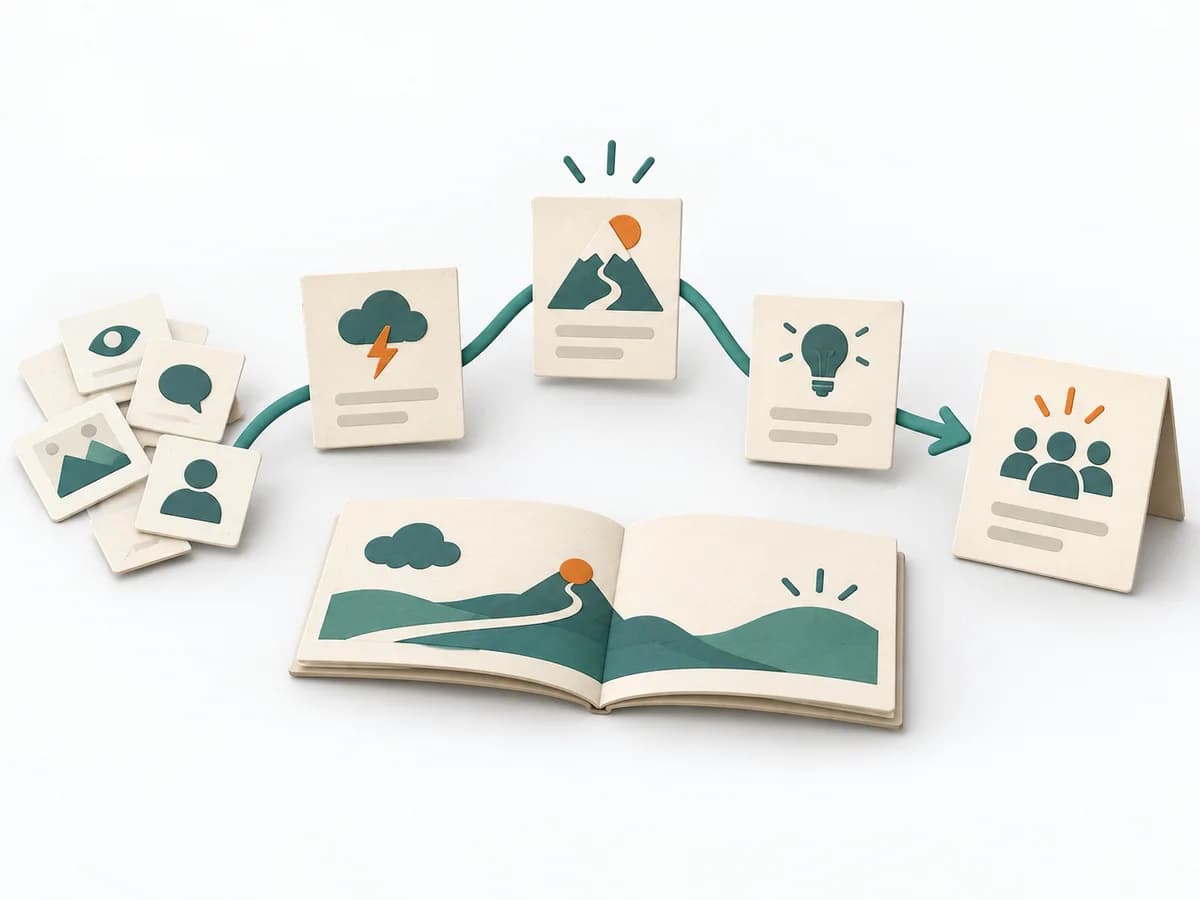 Facilitation Storytelling | 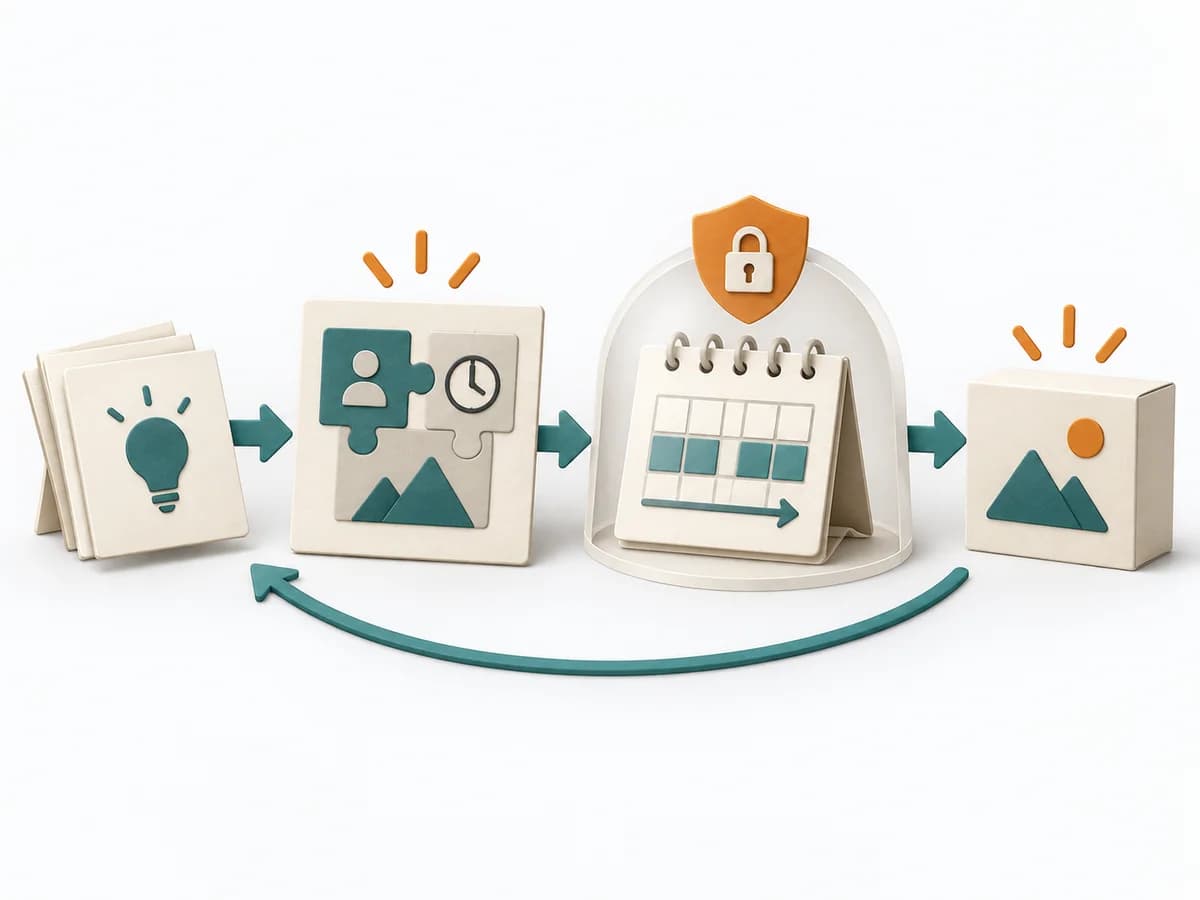 Delivery Shape Up |  Facilitation Power Interest Grid |
|---|---|---|---|---|
Purposedifferent | When capabilities, maturity levels, or market positions need to be compared across several dimensions, overview is easily lost. Radar brings different characteristics into a shared picture and shows patterns faster than tables do. | When an insight needs to have an effect, storytelling translates dry facts into a comprehensible development. It combines context, tension, and consequence into a form that people remember and pass on more easily. | Shape Up helps clarify scope, sequence, and delivery flow. It makes work boundaries and decisions explicit and captures results as pitches, bet-table decisions, and hill charts. | When many stakeholders compete for attention at once, the Power Interest Grid sorts them by influence and stake. It turns individual contributions into a visible selection. The result is captured as a Power Interest Grid and a stakeholder-specific strategy. |
Complexitydifferent | Medium | Medium | Medium | Low |
Timedifferent | 1-2 h | 45-120 min | 6 Wochen Cycle + 2 Wochen Cool-Down | 30-60 min |
Participantsdifferent | 2-10 | 1-6 | 2-4 pro Pitch | 2-8 |
Formatdifferent | Workshop + async | Workshop + async | Workshop + async | Workshop |
Outputdifferent | Radar Map, Capability Scores, Action Areas | Narrative Outline, Key Message, Story Arc | Pitches, Bet-table decisions, Hill charts, Cooldown outcomes | Power Interest Grid, Strategy per Stakeholder |
Tagsno overlap | AssessmentPortfolioCapability | CommunicationNarrativeStakeholdersFacilitation | PlanningDeliveryAutonomy | StakeholdersFacilitationAlignmentPlanning |