View methods side by side.
Choose up to four methods. Add them using the search and share the comparison by copying its link.
| Criterion |  Decision Making Radar | 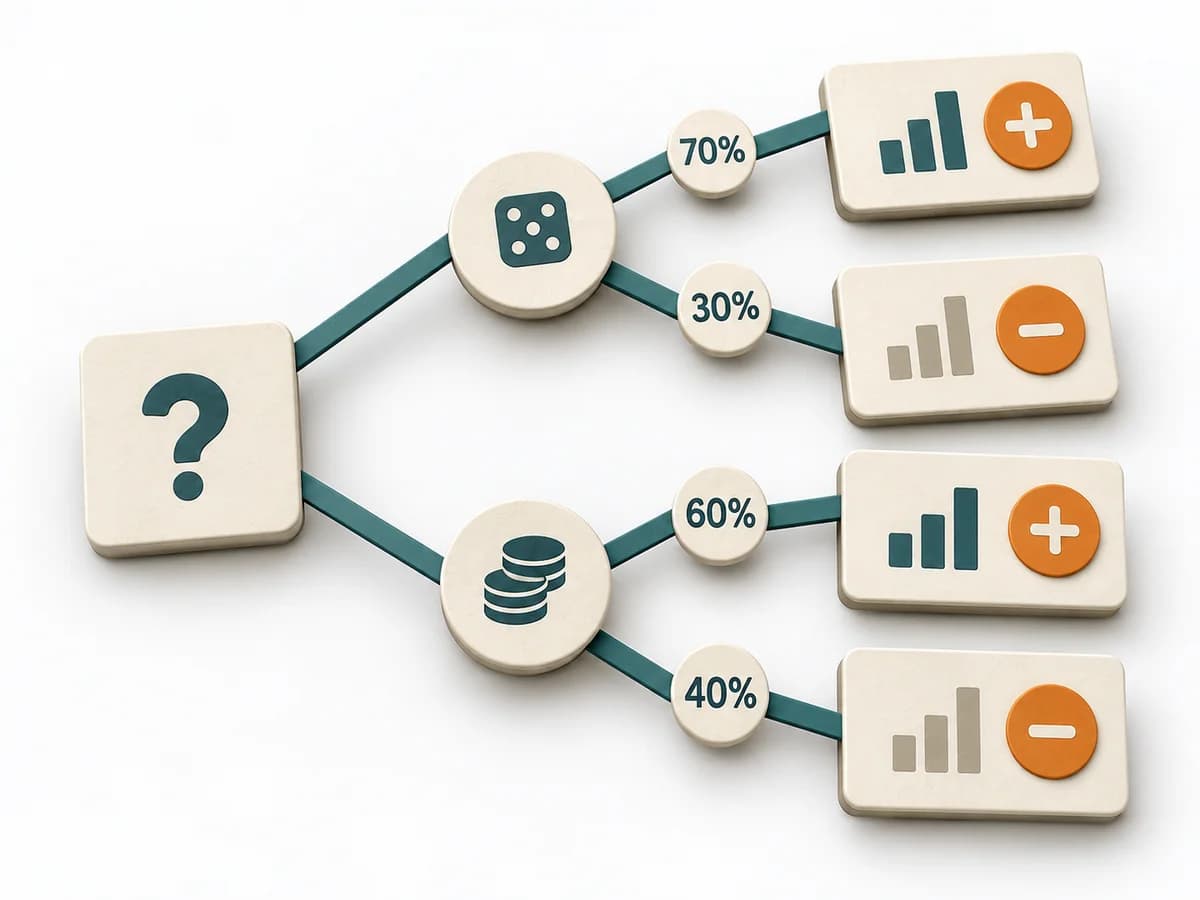 Decision Making Decision Tree | 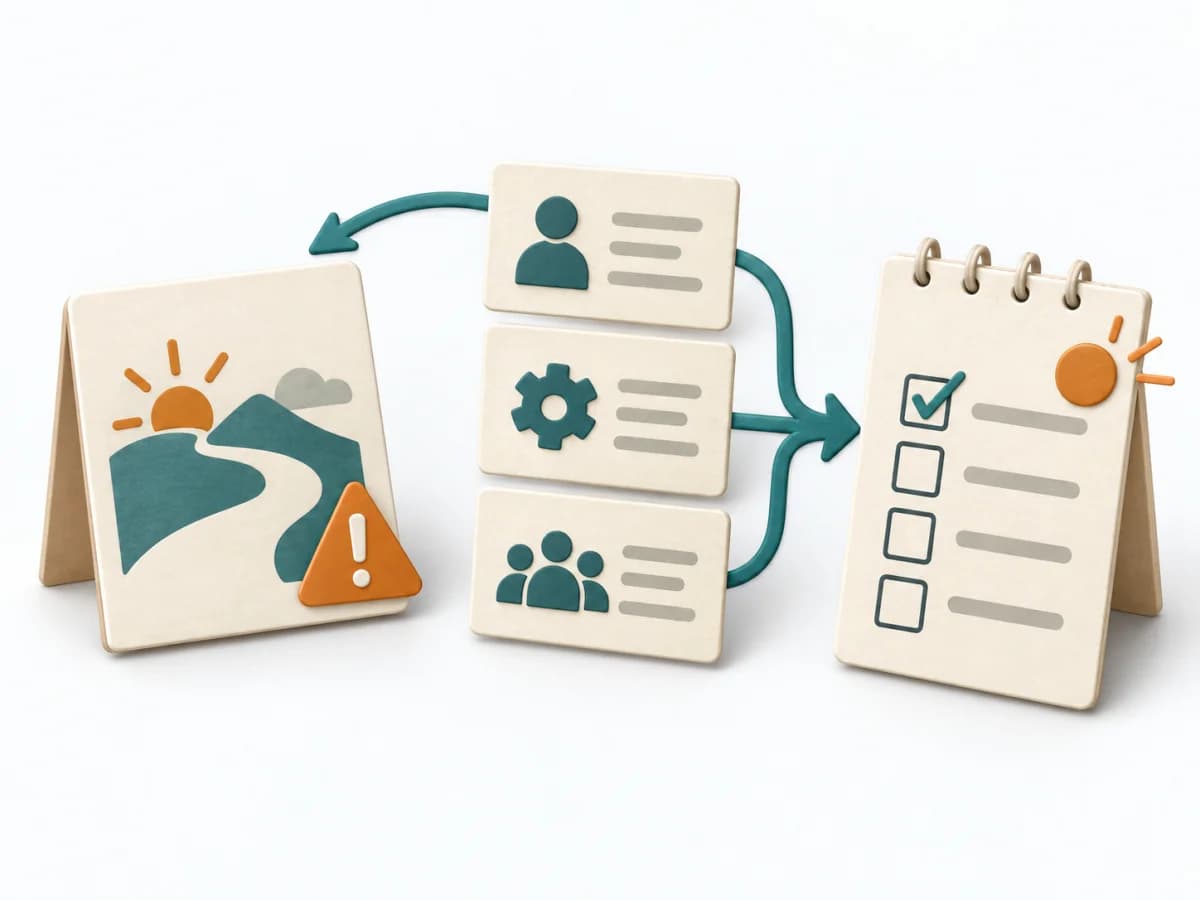 Decision Making Pre-Mortem | 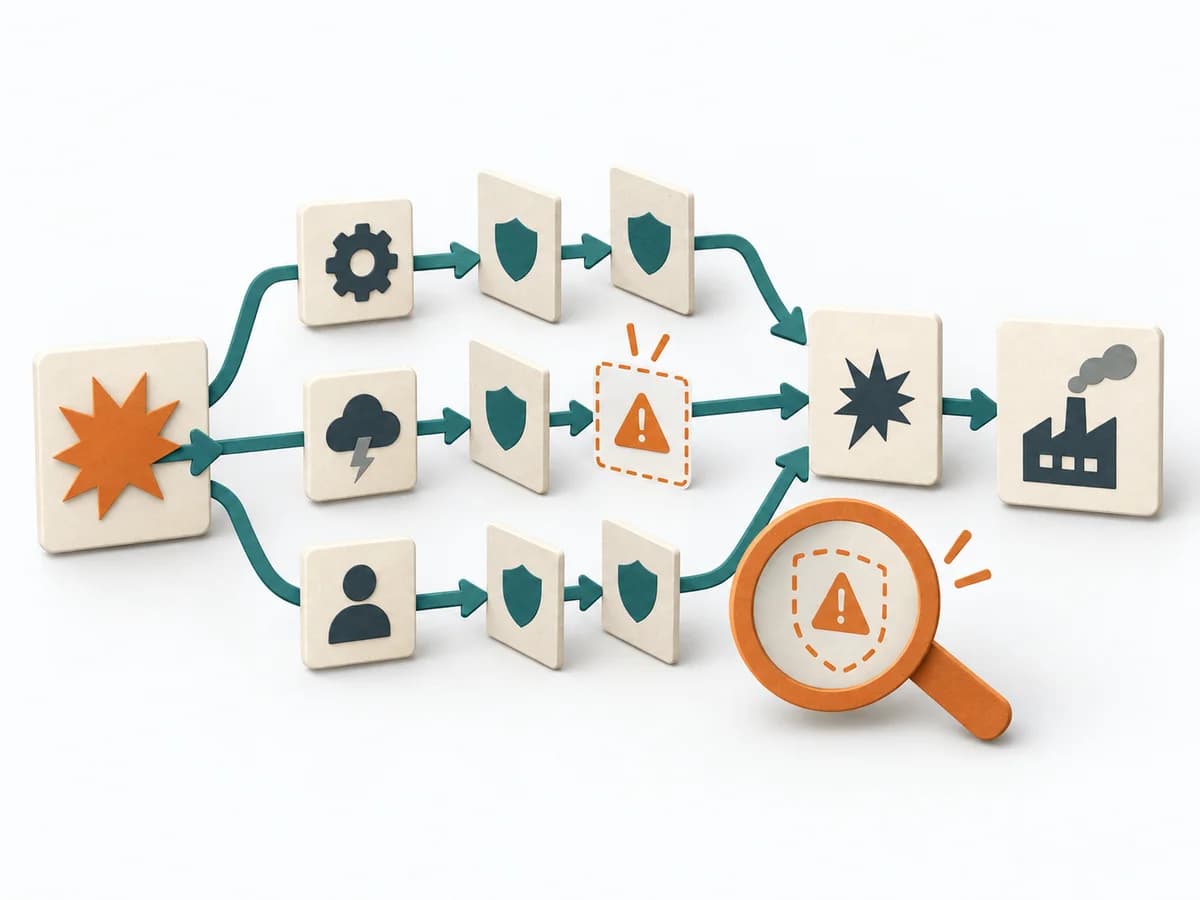 Engineering Failure Scenario Analysis |
|---|---|---|---|---|
Purposedifferent | When capabilities, maturity levels, or market positions need to be compared across several dimensions, overview is easily lost. Radar brings different characteristics into a shared picture and shows patterns faster than tables do. | For decisions with follow-on paths and dependencies, a linear comparison is often not enough. A Decision Tree shows how options branch under conditions and which consequences hang on each branch. | In early initiatives with many uncertainties, planning quickly turns too optimistic. A pre-mortem makes the expected failure visible in advance and sharpens the view of causes, gaps, and countermeasures. | In critical processes, it is not enough to plan only for the normal case. Failure Scenario Analysis looks at the path into failure and shows which failures, chains, and control gaps cause the most damage. |
Complexitydifferent | Medium | Medium | Low | Medium |
Timedifferent | 1-2 h | 30-90 min | 20–45 min | 1-3 h |
Participantsdifferent | 2-10 | 1-6 | Small cross-functional group | 3-8 |
Formatdifferent | Workshop + async | Workshop + async | Workshop | Workshop |
Outputdifferent | Radar Map, Capability Scores, Action Areas | Decision Tree, Option Map, Assumption List | Risk list, Mitigation plan, Assumption log | Failure Scenarios, Risk Notes, Control Gaps, Test and Response Actions |
Tagsno overlap | AssessmentPortfolioCapability | DecisionTreeOptions | RiskDecisionFailurePlanning | FailureResilienceRisk |