View methods side by side.
Choose up to four methods. Add them using the search and share the comparison by copying its link.
| Criterion |  Decision Making Radar | 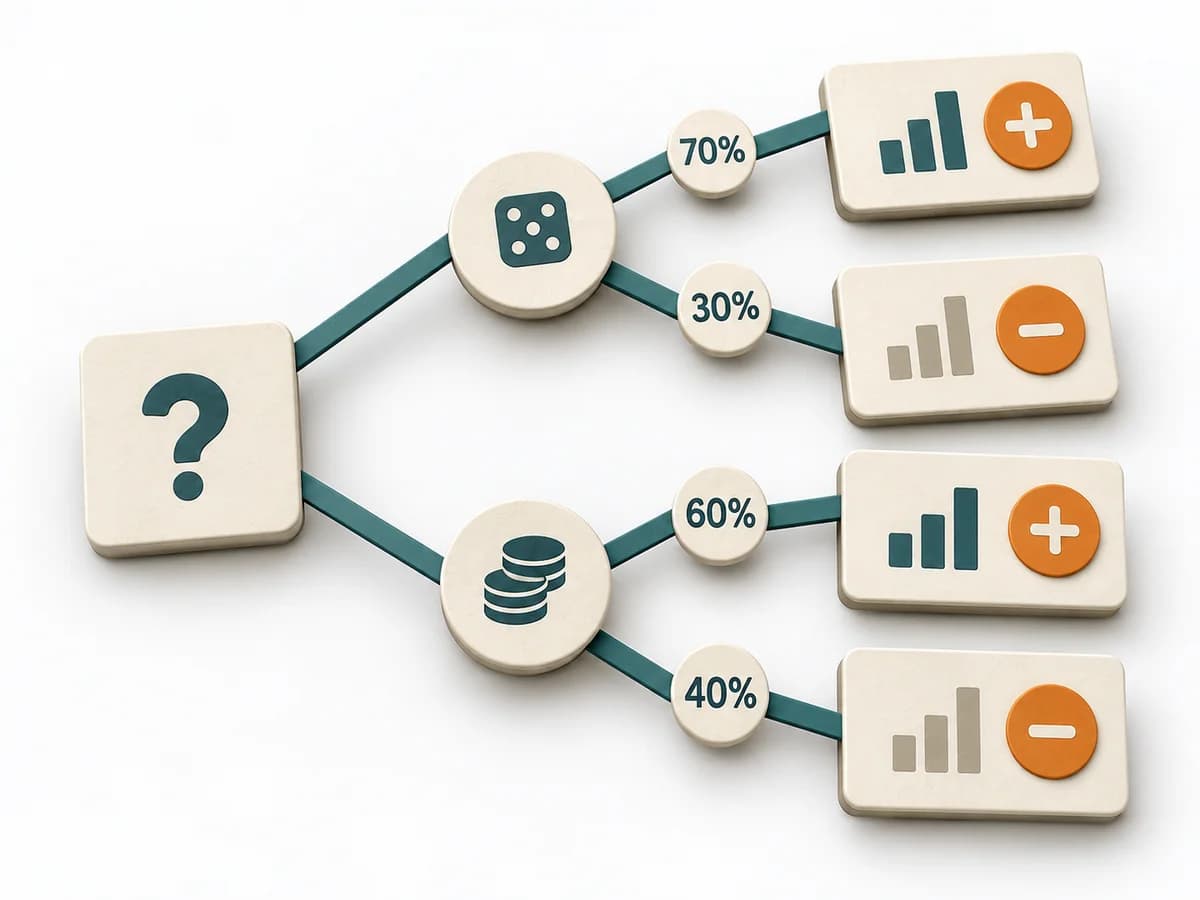 Decision Making Decision Tree |  Product Strategy ICE Scoring |  Business Strategy Ansoff Matrix |
|---|---|---|---|---|
Purposedifferent | When capabilities, maturity levels, or market positions need to be compared across several dimensions, overview is easily lost. Radar brings different characteristics into a shared picture and shows patterns faster than tables do. | For decisions with follow-on paths and dependencies, a linear comparison is often not enough. A Decision Tree shows how options branch under conditions and which consequences hang on each branch. | When ideas need sorting quickly, it condenses impact, confidence, and effort into one compact score. It connects customer value, product logic, and decision priorities. The result is captured as an ICE table and top-ideas list. | The Ansoff Matrix organizes growth options by market and product relation. It helps weigh expansion, diversification, and adaptation cleanly against each other. |
Complexitydifferent | Medium | Medium | Low | Low |
Timedifferent | 1-2 h | 30-90 min | 30-60 min | 45-90 min |
Participantsdifferent | 2-10 | 1-6 | 2-8 | 2-8 |
Formatsame | Workshop + async | Workshop + async | Workshop + async | Workshop + async |
Outputdifferent | Radar Map, Capability Scores, Action Areas | Decision Tree, Option Map, Assumption List | ICE Table, Top Idea List | Ansoff Matrix, Growth Options, Risk Notes |
Tagsno overlap | AssessmentPortfolioCapability | DecisionTreeOptions | PrioritizationScoringGrowthDecision | GrowthStrategyMarketPortfolio |