View methods side by side.
Choose up to four methods. Add them using the search and share the comparison by copying its link.
| Criterion | 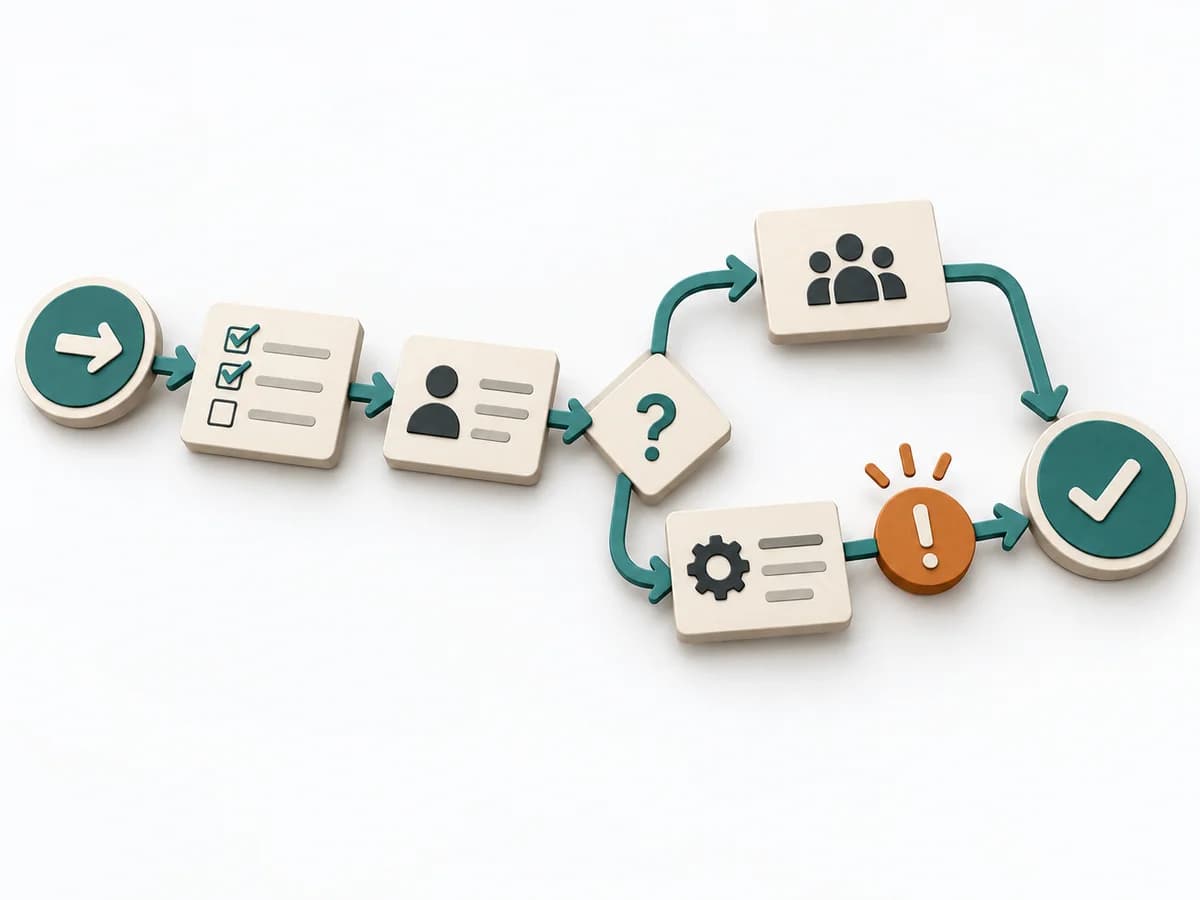 Operations Process Mapping |  Facilitation Dot Estimation |  Operations Failure Mode and Effects Analysis | 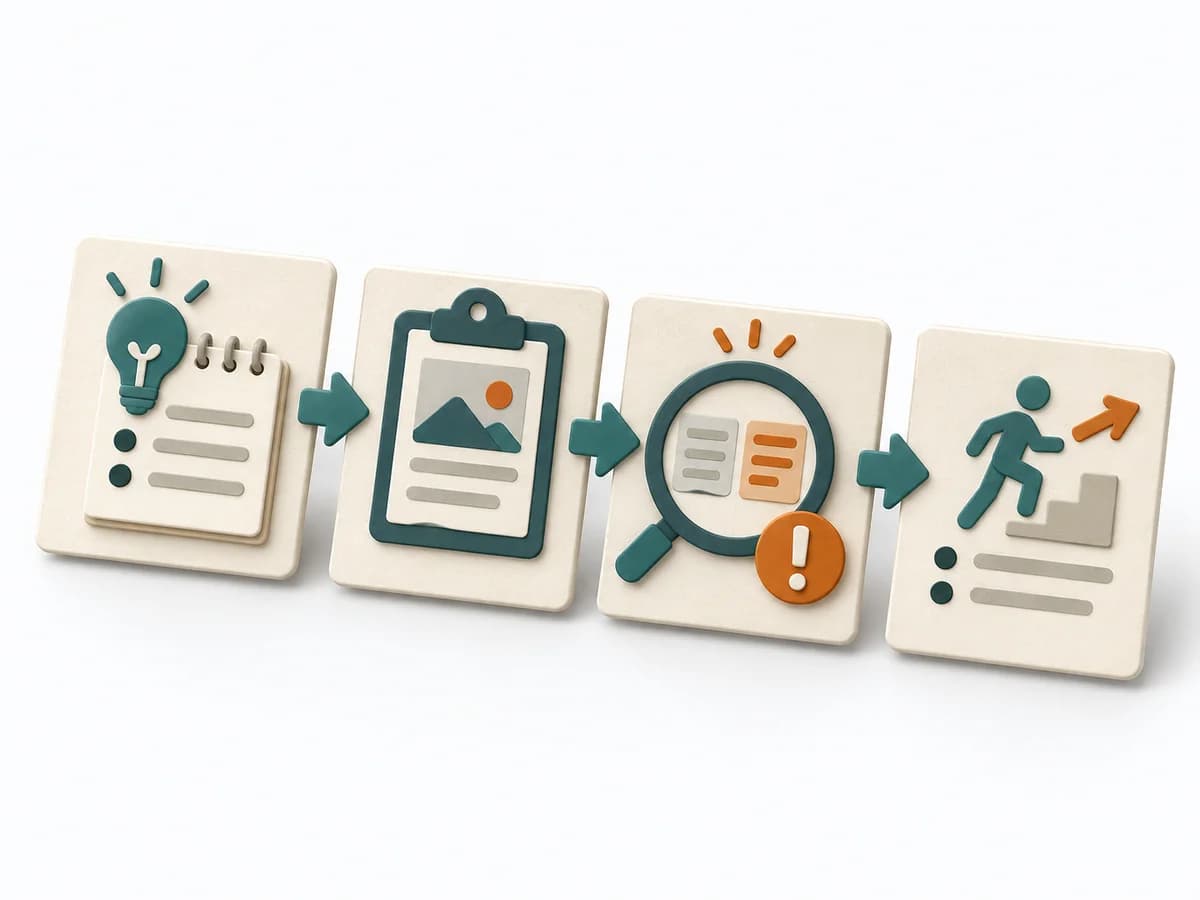 Operations After-Action Review |
|---|---|---|---|---|
Purposedifferent | With a confusing workflow that has many handoffs, the method makes the actual process visible. It shows where work is passed on, delayed, or duplicated, so improvement targets the right spots. | When size or effort can only be estimated roughly, Dot Estimation condenses the group's experience into a quick range. It turns individual contributions into a visible selection. The result is captured as an Effort Heatmap, Risk Signals, and Discussion Targets. | For a process, product, or service with noticeable failure risks, the method assesses possible failure modes in advance. It directs attention to combinations of occurrence, effect, and detectability. | After missions or project phases with unclear outcomes, the method makes visible what actually happened and what can be learned from it. It separates course, effect, and causes so experience turns into solid improvement. |
Complexitydifferent | Medium | Low | High | Low |
Timedifferent | 1-3 h | 5-20 min | 2-6 h | 20-45 min |
Participantsdifferent | 3-10 | 3-20 | 3-10 | 3-12 |
Formatdifferent | Workshop | Workshop | Workshop | Workshop + async |
Outputdifferent | Process Map, Handoff List, Improvement Backlog | Effort Heatmap, Risk Signals, Discussion Targets | FMEA Table, Risk Priority, Mitigation Actions | Lessons learned, Action items, Event summary |
Tagsno overlap | ProcessOperationsImprovement | EstimationEffortRisk | RiskQualityOperationsRoot cause | LearningOperationsImprovement |