View methods side by side.
Choose up to four methods. Add them using the search and share the comparison by copying its link.
Selected:Power Interest GridFailure Mode and Effects AnalysisStakeholder Mapping3-Circle Venn Diagram
| Criterion | 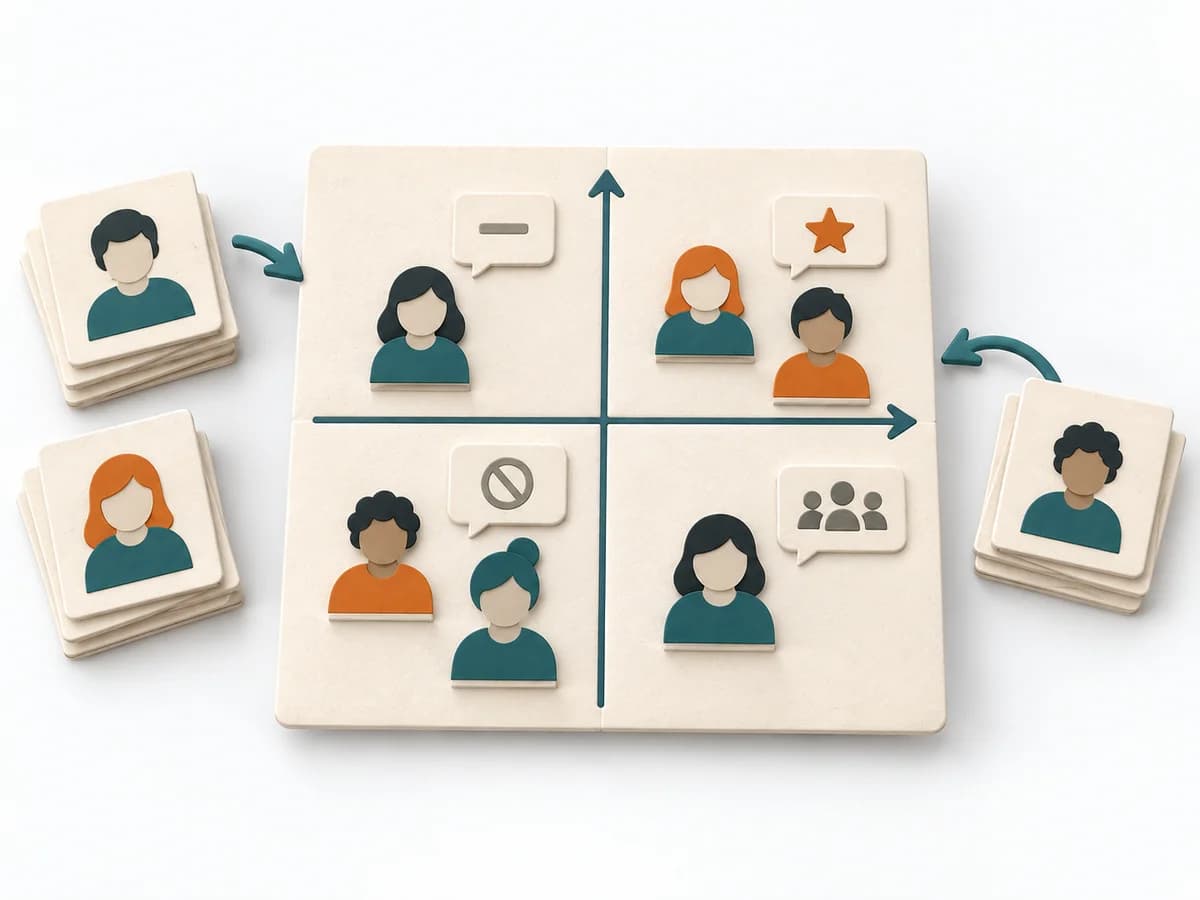 Facilitation Power Interest Grid |  Operations Failure Mode and Effects Analysis |  Facilitation Stakeholder Mapping | 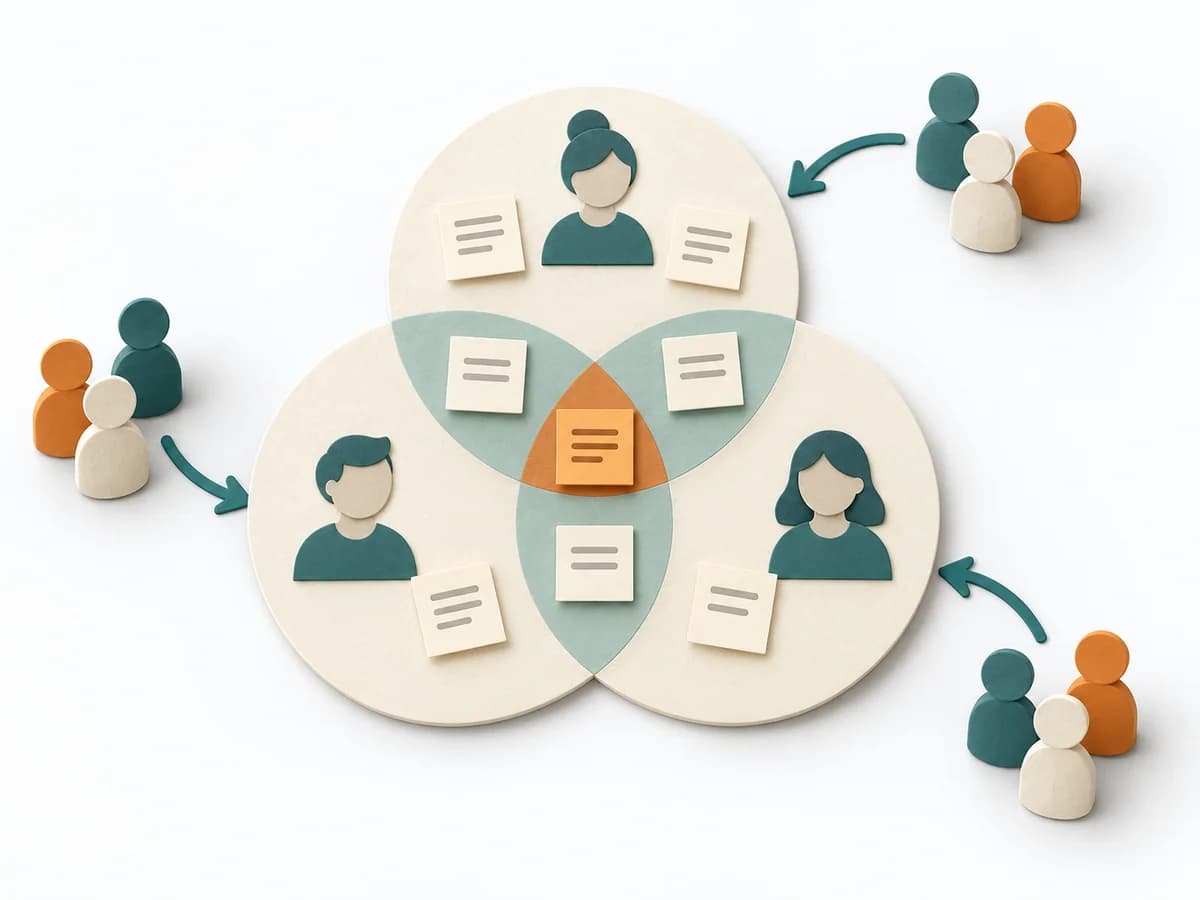 Facilitation 3-Circle Venn Diagram |
|---|---|---|---|---|
Purposedifferent | When many stakeholders compete for attention at once, the Power Interest Grid sorts them by influence and stake. It turns individual contributions into a visible selection. The result is captured as a Power Interest Grid and a stakeholder-specific strategy. | For a process, product, or service with noticeable failure risks, the method assesses possible failure modes in advance. It directs attention to combinations of occurrence, effect, and detectability. | When an initiative depends on many people, interests, and power dynamics, Stakeholder Mapping systematically orders the environment. It shows who influences, who is affected, and where relationship management or safeguarding matters first. | When three perspectives matter at the same time, a Three-Circle Venn Diagram shows the overlaps and remainders precisely. It makes visible where shared effect arises and where only a partial perspective applies. |
Complexitydifferent | Low | High | Low | Low |
Timedifferent | 30-60 min | 2-6 h | 60–90 min | 15-45 min |
Participantsdifferent | 2-8 | 3-10 | 2-8 | 2-8 |
Formatdifferent | Workshop | Workshop | Workshop + async | Workshop + async |
Outputdifferent | Power Interest Grid, Strategy per Stakeholder | FMEA Table, Risk Priority, Mitigation Actions | Stakeholder Map, Engagement Plan, Risk Notes | Venn Diagram, Overlap Notes, Differentiators |
Tagsno overlap | StakeholdersFacilitationAlignmentPlanning | RiskQualityOperationsRoot cause | StakeholdersAlignmentFacilitationChange | ComparisonFacilitationAlignment |