View methods side by side.
Choose up to four methods. Add them using the search and share the comparison by copying its link.
| Criterion | 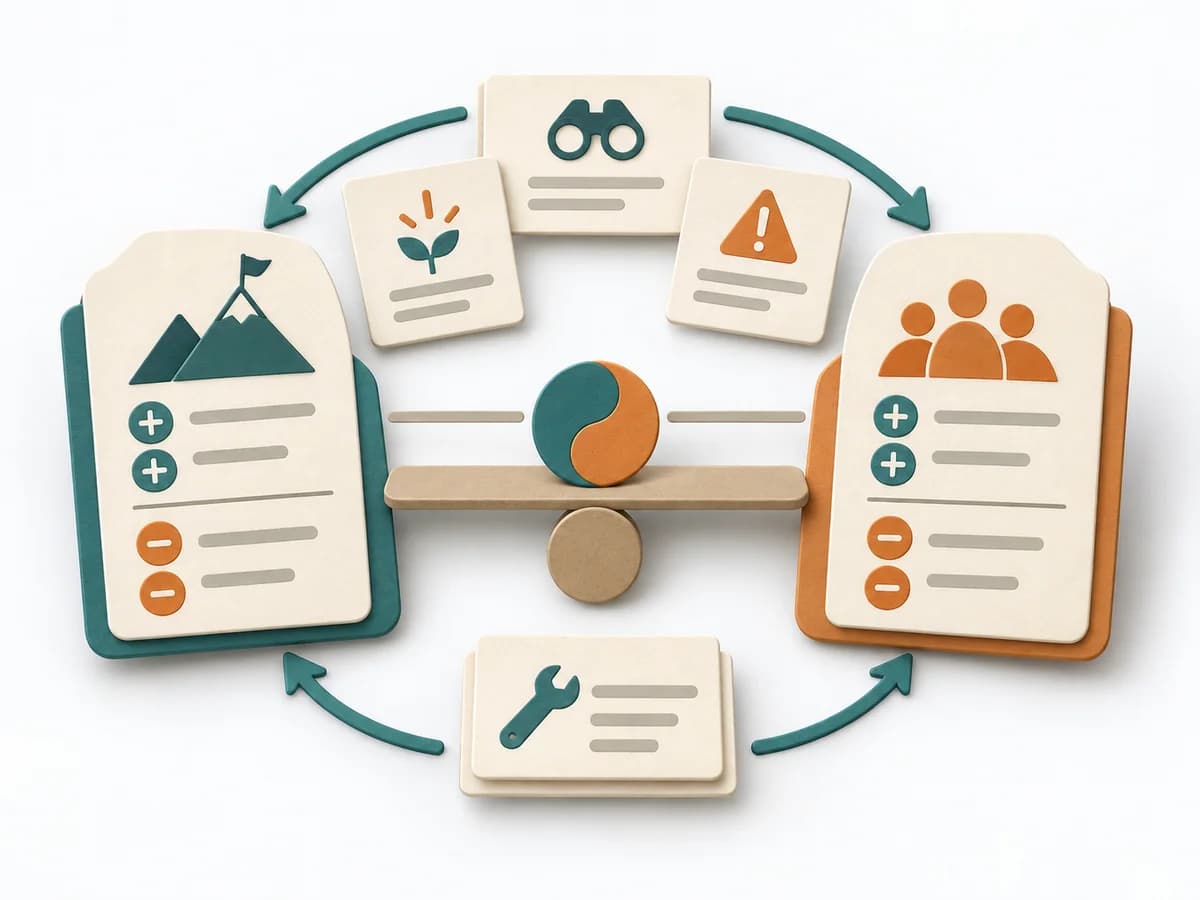 Systems Thinking Polarity Mapping |  Agile WSJF |  Operations Root Cause Analysis | 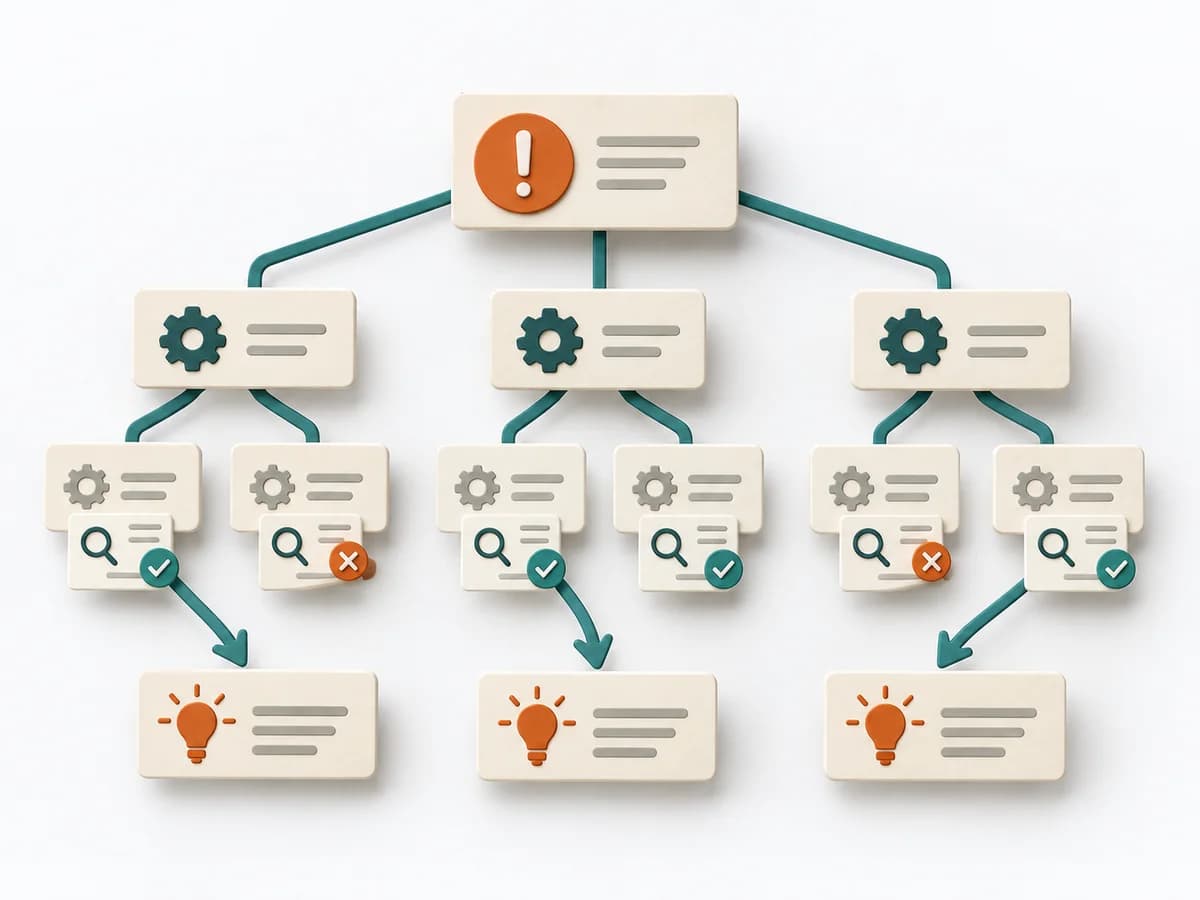 Operations Root Cause Tree Analysis |
|---|---|---|---|---|
Purposedifferent | Polarity Mapping makes tensions between two opposing poles tangible, such as standardization and adaptation or control and autonomy. The method guards against making apparent either-or decisions prematurely. | When many tasks compete for the same capacity, it orders work by economic impact. It makes time lost, benefit, and effort comparable together. | When a problem keeps recurring and the cause stays unclear, the method exposes the underlying mechanism. It separates symptom, guess, and robust explanation from one another. | For a problem with several suspected causes, the method builds a causal structure instead of a mere list. It makes visible how causes connect and where the strongest points of leverage lie. |
Complexitydifferent | Medium | High | Medium | Medium |
Timedifferent | 1-2 h | 45-90 min | 1-4 h | 1-3 h |
Participantsdifferent | 3-12 | 3-10 | 3-8 | 2-8 |
Formatdifferent | Workshop | Workshop | Workshop + async | Workshop |
Outputdifferent | Polarity Map, Warning Signs, Balance Actions | Ranked Backlog, Cost-of-Delay Assumptions | Problem Statement, Cause Hypotheses, Confirmed Causes, Action Plan | Cause Tree, Evidence Notes, Countermeasures |
Tagsno overlap | Systems thinkingTradeoffsLeadership | LeanEconomicsSequencePrioritization | Root causeProblem solvingQualityIncident | Root causeTreeIncidentQuality |