View methods side by side.
Choose up to four methods. Add them using the search and share the comparison by copying its link.
| Criterion | 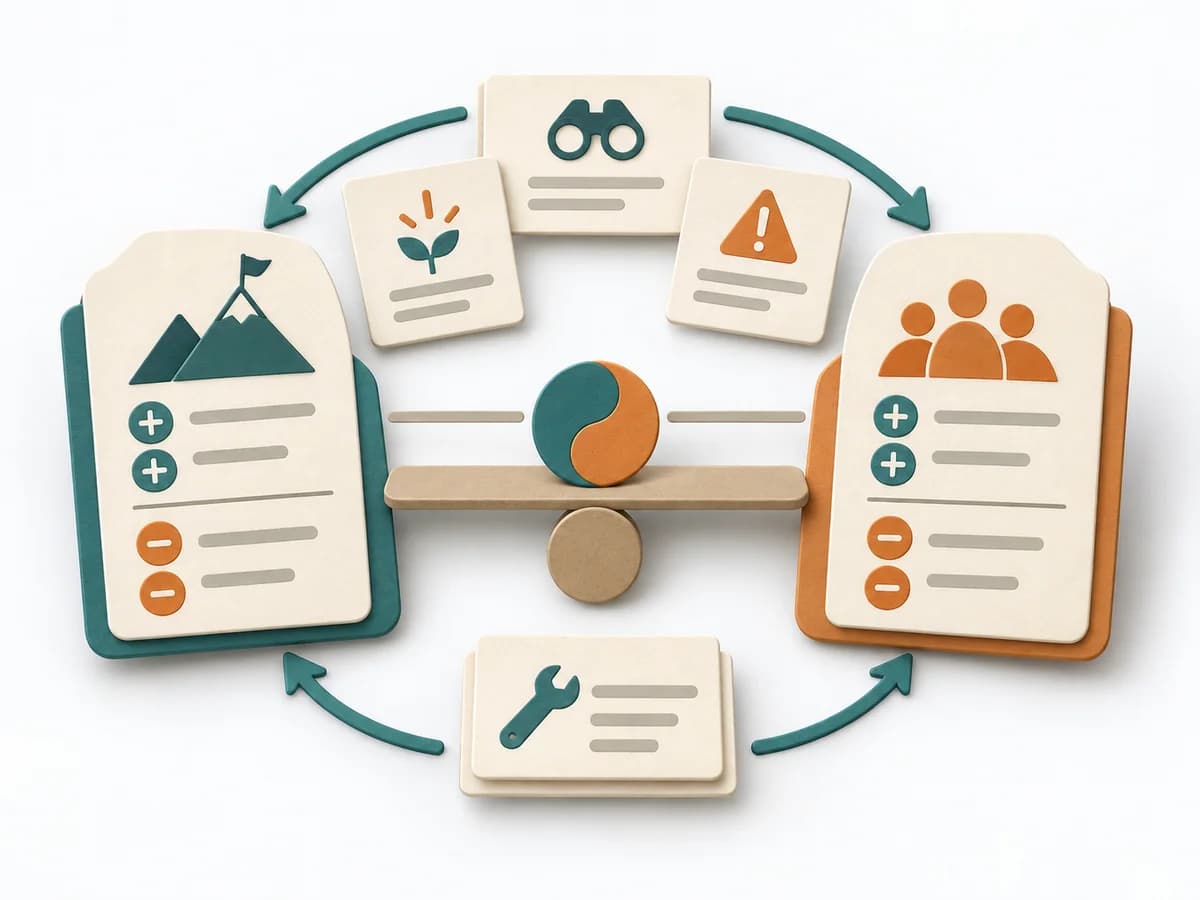 Systems Thinking Polarity Mapping |  Operations Fishbone Diagram |  Operations Barrier Analysis | 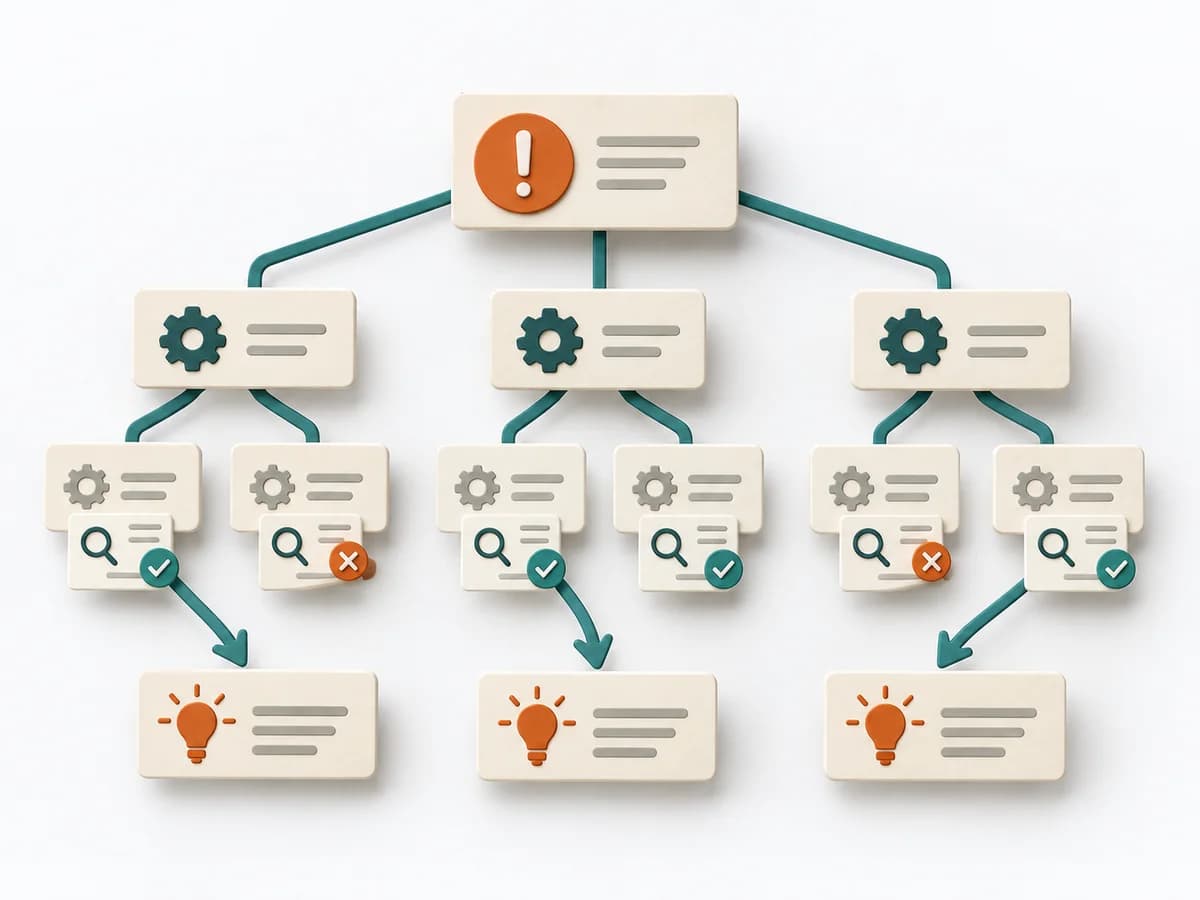 Operations Root Cause Tree Analysis |
|---|---|---|---|---|
Purposedifferent | Polarity Mapping makes tensions between two opposing poles tangible, such as standardization and adaptation or control and autonomy. The method guards against making apparent either-or decisions prematurely. | When a problem has several possible contributing factors, the method sorts causes by cause areas. It prevents an initial hunch from blocking the view of other plausible drivers. | For a risk that can only be managed through multiple layers of protection, the method examines the effectiveness of each barrier. It shows where safeguards are missing, too weak, or fail under real conditions. | For a problem with several suspected causes, the method builds a causal structure instead of a mere list. It makes visible how causes connect and where the strongest points of leverage lie. |
Complexitydifferent | Medium | Low | Medium | Medium |
Timedifferent | 1-2 h | 30-60 min | 2-4 h | 1-3 h |
Participantsdifferent | 3-12 | 2-8 | 2-6 | 2-8 |
Formatdifferent | Workshop | Workshop | Workshop + async | Workshop |
Outputdifferent | Polarity Map, Warning Signs, Balance Actions | Fishbone Diagram, Cause Categories, Investigation Backlog | Barrier Inventory, Failure Analysis per Barrier, Action Backlog | Cause Tree, Evidence Notes, Countermeasures |
Tagsno overlap | Systems thinkingTradeoffsLeadership | Root causeQualityOperations | Root causeSafetyIncident | Root causeTreeIncidentQuality |