View methods side by side.
Choose up to four methods. Add them using the search and share the comparison by copying its link.
| Criterion | 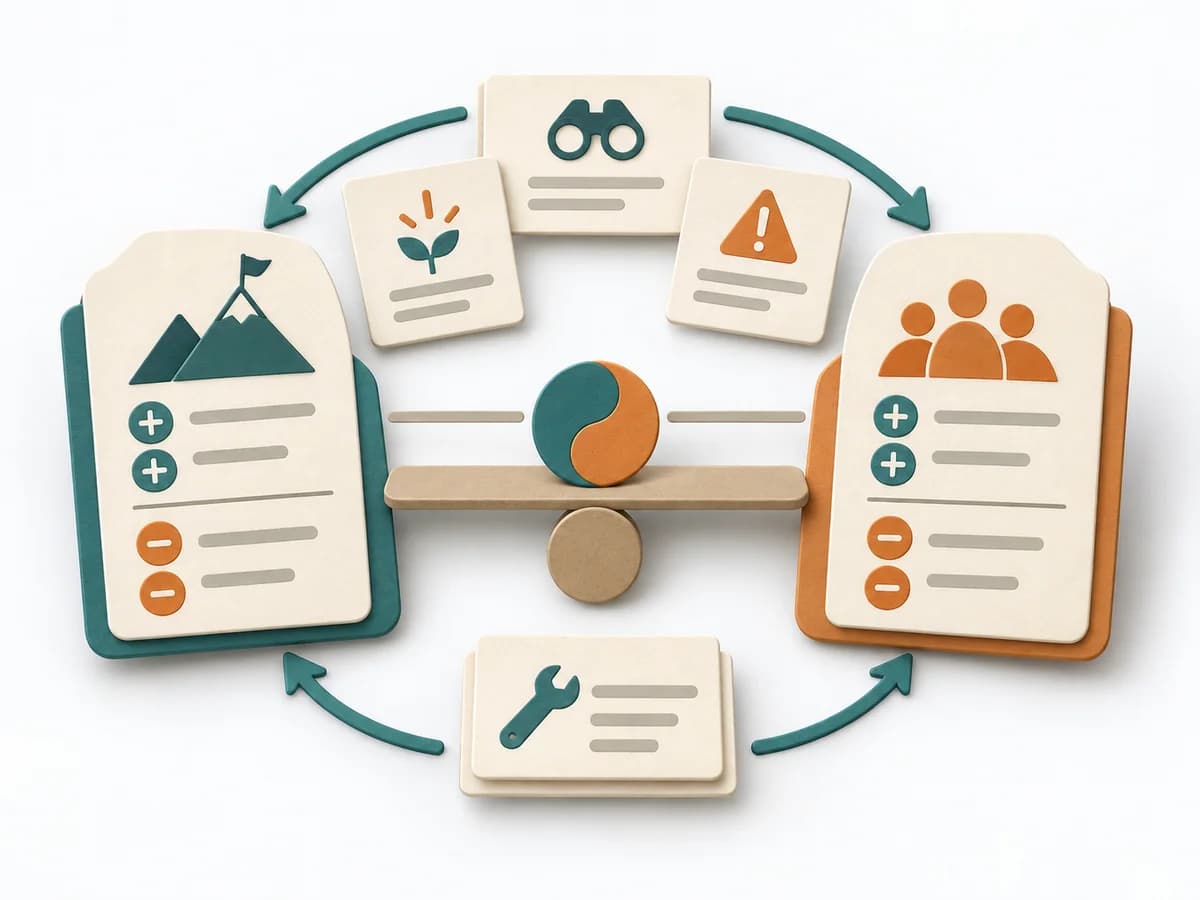 Systems Thinking Polarity Mapping | 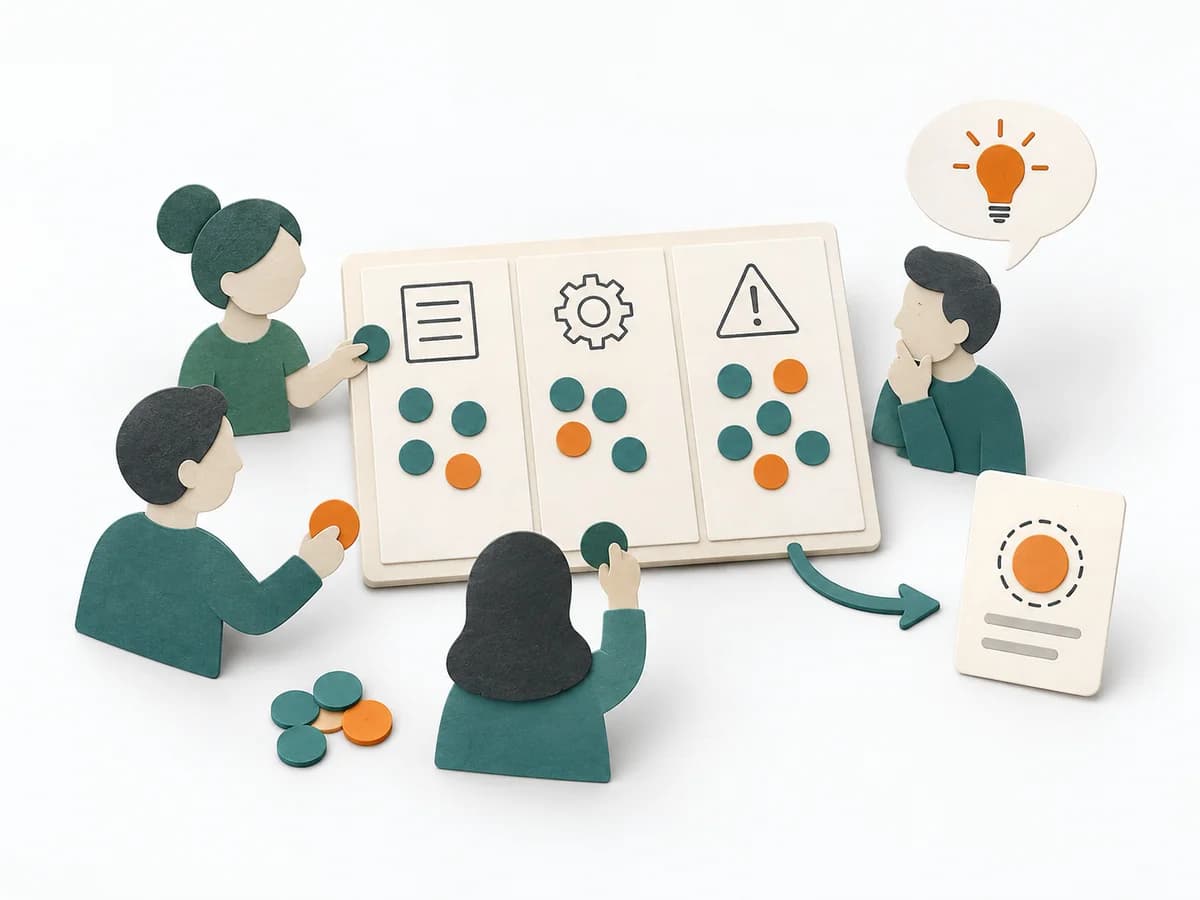 Facilitation Dot Estimation | 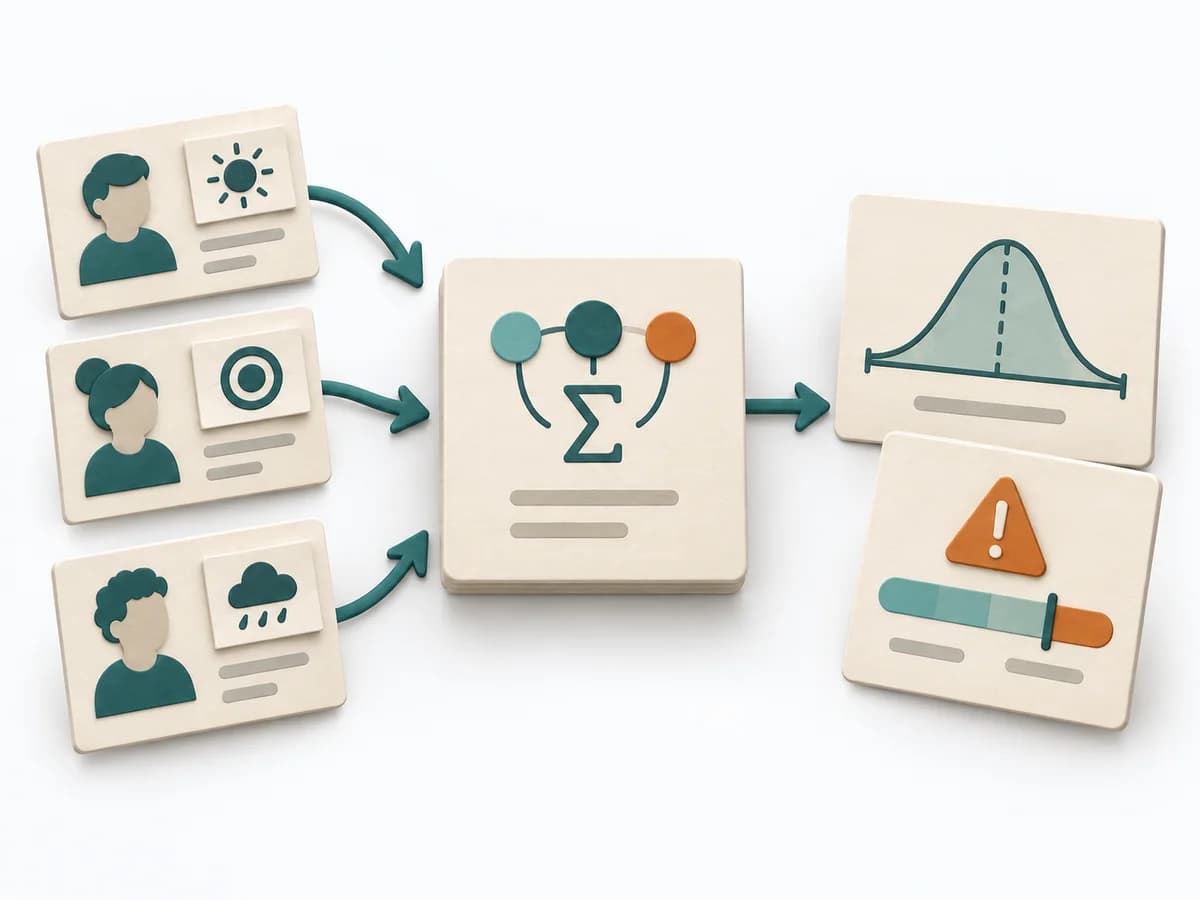 Decision Making PERT Estimation |  Operations Accountability Ladder |
|---|---|---|---|---|
Purposedifferent | Polarity Mapping makes tensions between two opposing poles tangible, such as standardization and adaptation or control and autonomy. The method guards against making apparent either-or decisions prematurely. | When size or effort can only be estimated roughly, Dot Estimation condenses the group's experience into a quick range. It turns individual contributions into a visible selection. The result is captured as an Effort Heatmap, Risk Signals, and Discussion Targets. | On complex initiatives, a plain average tends to understate just how uncertain the outcome really is. It separates options, evaluation criteria, and open risks. The result is captured as a PERT Estimate, Expected Value, and Risk Notes. | With defensive reactions to problems, the method shifts the view from justification to ownership. It makes visible which reaction stage a person or team is currently stuck on. |
Complexitydifferent | Medium | Low | Medium | Low |
Timedifferent | 1-2 h | 5-20 min | 15-45 min | 20-45 min |
Participantsdifferent | 3-12 | 3-20 | 1-8 | 1-8 |
Formatdifferent | Workshop | Workshop | Workshop + async | Workshop + async |
Outputdifferent | Polarity Map, Warning Signs, Balance Actions | Effort Heatmap, Risk Signals, Discussion Targets | PERT Estimate, Expected Value, Risk Notes | Ownership Reflection, Action Commitment, Coaching Notes |
Tagsno overlap | Systems thinkingTradeoffsLeadership | EstimationEffortRisk | EstimationUncertaintyRisk | ResponsibilityLeadershipTeam |