View methods side by side.
Choose up to four methods. Add them using the search and share the comparison by copying its link.
| Criterion | 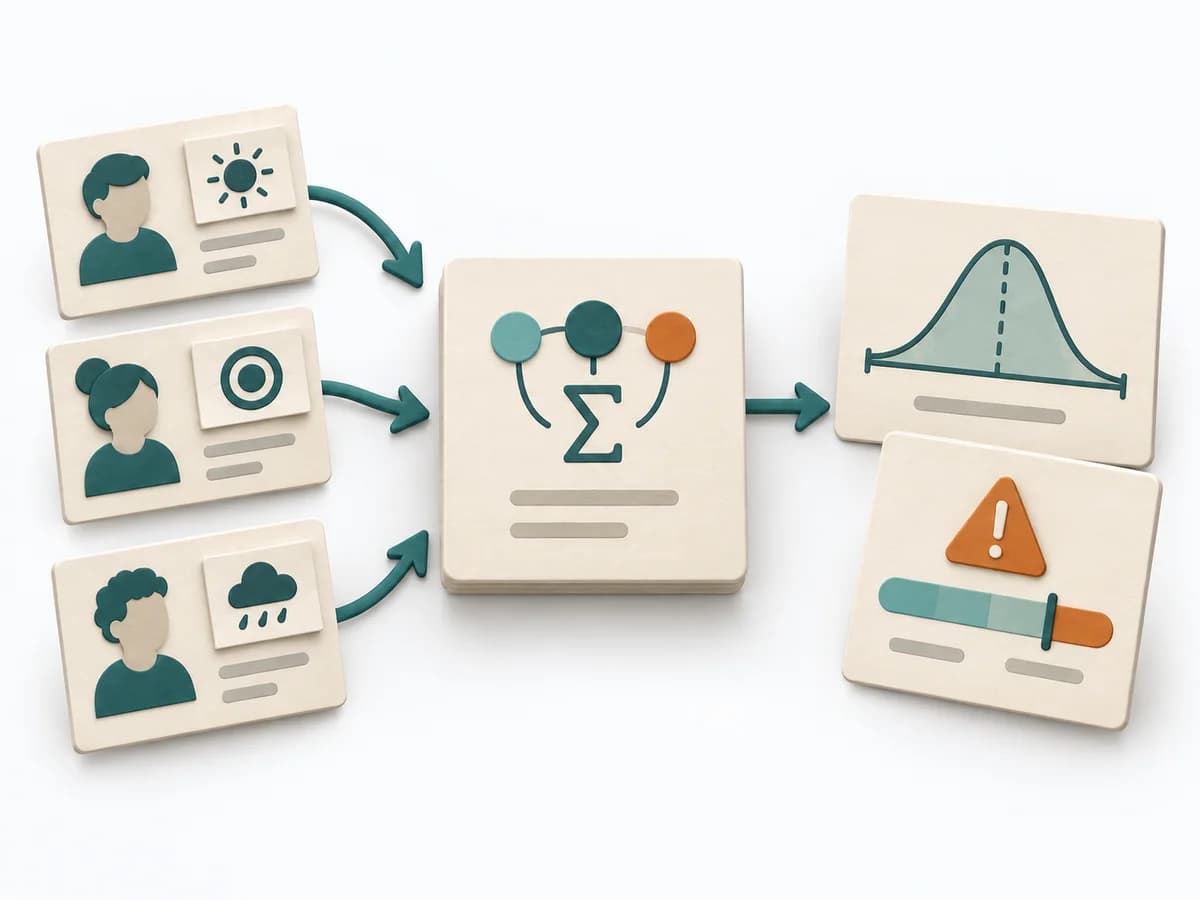 Decision Making PERT Estimation | 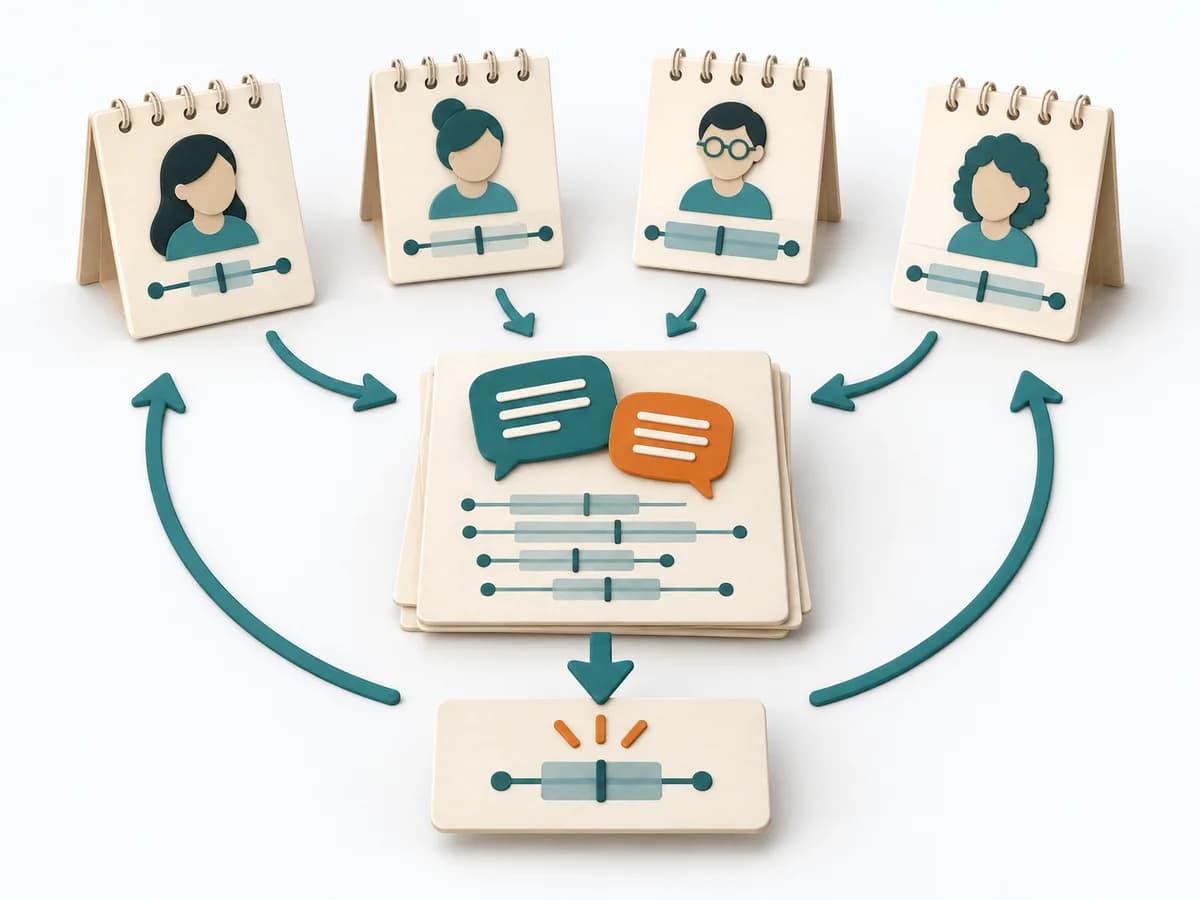 Decision Making Wideband Delphi |  Operations Fishbone Diagram | 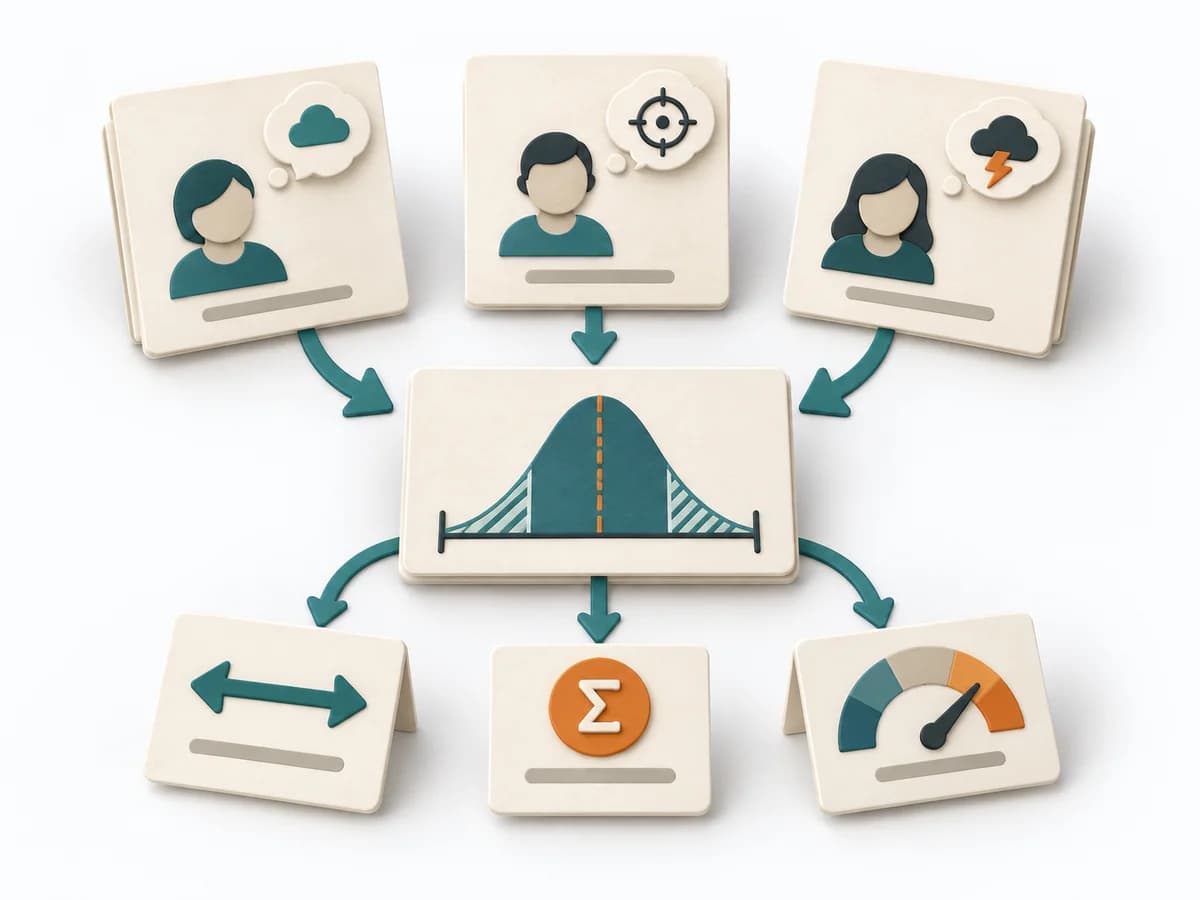 Decision Making Three-Point Estimation |
|---|---|---|---|---|
Purposedifferent | On complex initiatives, a plain average tends to understate just how uncertain the outcome really is. It separates options, evaluation criteria, and open risks. The result is captured as a PERT Estimate, Expected Value, and Risk Notes. | A single opinion rarely holds up for planning when the future is genuinely uncertain. It separates options, evaluation criteria, and open risks. The result is captured as an Estimate Range, Assumption Log, and Expert Consensus Notes. | When a problem has several possible contributing factors, the method sorts causes by cause areas. It prevents an initial hunch from blocking the view of other plausible drivers. | A single estimate for effort, time, or risk often looks too smooth for the real uncertainty behind it. It separates options, evaluation criteria, and open risks. The result is captured as a Three-Point Estimate, Risk Range, and Assumption Notes. |
Complexitydifferent | Medium | High | Low | Medium |
Timedifferent | 15-45 min | 1-4 h or multiple rounds | 30-60 min | 10-30 min je Item |
Participantsdifferent | 1-8 | 4-12 Experten | 2-8 | 1-8 |
Formatdifferent | Workshop + async | Workshop + async | Workshop | Workshop + async |
Outputdifferent | PERT Estimate, Expected Value, Risk Notes | Estimate Range, Assumption Log, Expert Consensus Notes | Fishbone Diagram, Cause Categories, Investigation Backlog | Three-Point Estimate, Risk Range, Assumption Notes |
Tagsno overlap | EstimationUncertaintyRisk | EstimationExpertsForecasting | Root causeQualityOperations | EstimationUncertaintyForecasting |