View methods side by side.
Choose up to four methods. Add them using the search and share the comparison by copying its link.
| Criterion | 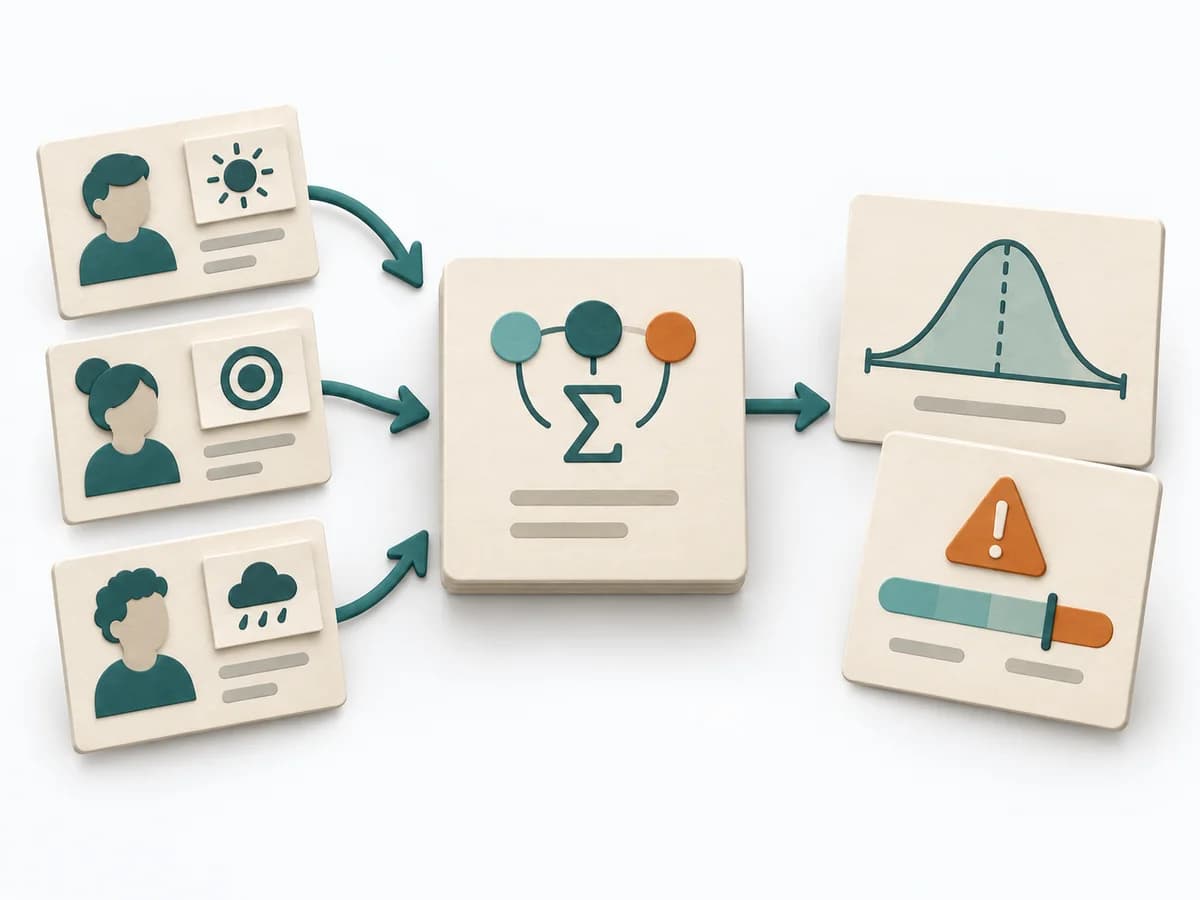 Decision Making PERT Estimation |  Operations PDCA Cycle |  Product Strategy DIBB |  Product Strategy Counter Metrics |
|---|---|---|---|---|
Purposedifferent | On complex initiatives, a plain average tends to understate just how uncertain the outcome really is. It separates options, evaluation criteria, and open risks. The result is captured as a PERT Estimate, Expected Value, and Risk Notes. | For an improvement that still has to prove itself in everyday work, the method runs it through small learning loops. It connects planning, checking, and standardization into a repeatable learning mode. | DIBB helps clarify target groups, value, goals, and priorities by making the logic behind a decision explicit. It captures results as a DIBB document, belief list, bet list, and learning report. | When a headline metric could mask side effects, it adds guardrail signals against unwanted outcomes. It connects customer value, product logic, and decision priorities. The result is captured as a counter-metric list and guardrail definitions. |
Complexitydifferent | Medium | Low | Low | Low |
Timedifferent | 15-45 min | 1 h bis mehrere Wochen | 1-2 h | 30-60 min |
Participantsdifferent | 1-8 | 1-8 | 2-8 | 2-6 |
Formatsame | Workshop + async | Workshop + async | Workshop + async | Workshop + async |
Outputdifferent | PERT Estimate, Expected Value, Risk Notes | PDCA Log, Experiment Plan, Learning Outcome, Standard Change | DIBB document, Belief list, Bet list, Learning report | Counter Metric List, Guardrail Definitions |
Tagsno overlap | EstimationUncertaintyRisk | Continuous improvementLeanExperiments | StrategyDecisionAssumptionsHypothesis | MetricsMeasurementStrategyExperiments |