View methods side by side.
Choose up to four methods. Add them using the search and share the comparison by copying its link.
| Criterion | 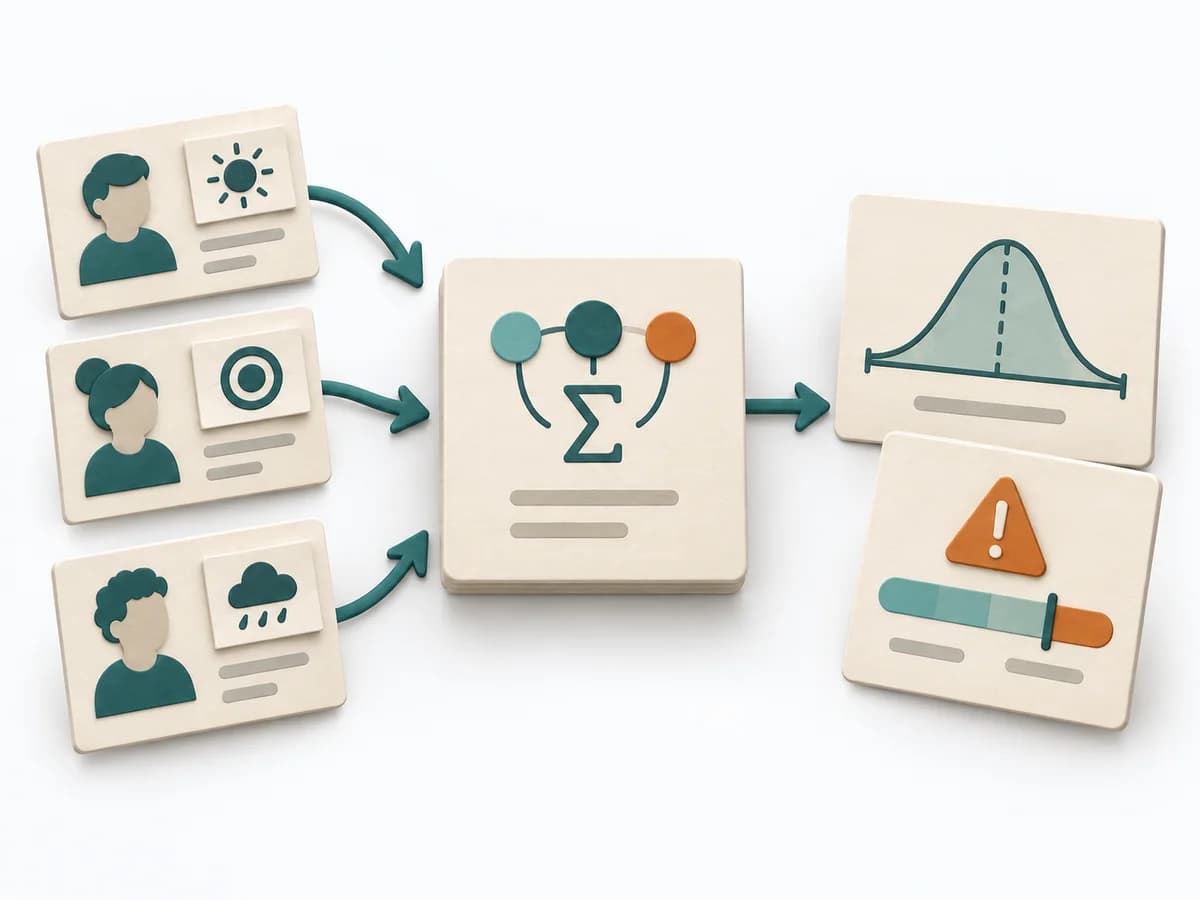 Decision Making PERT Estimation | 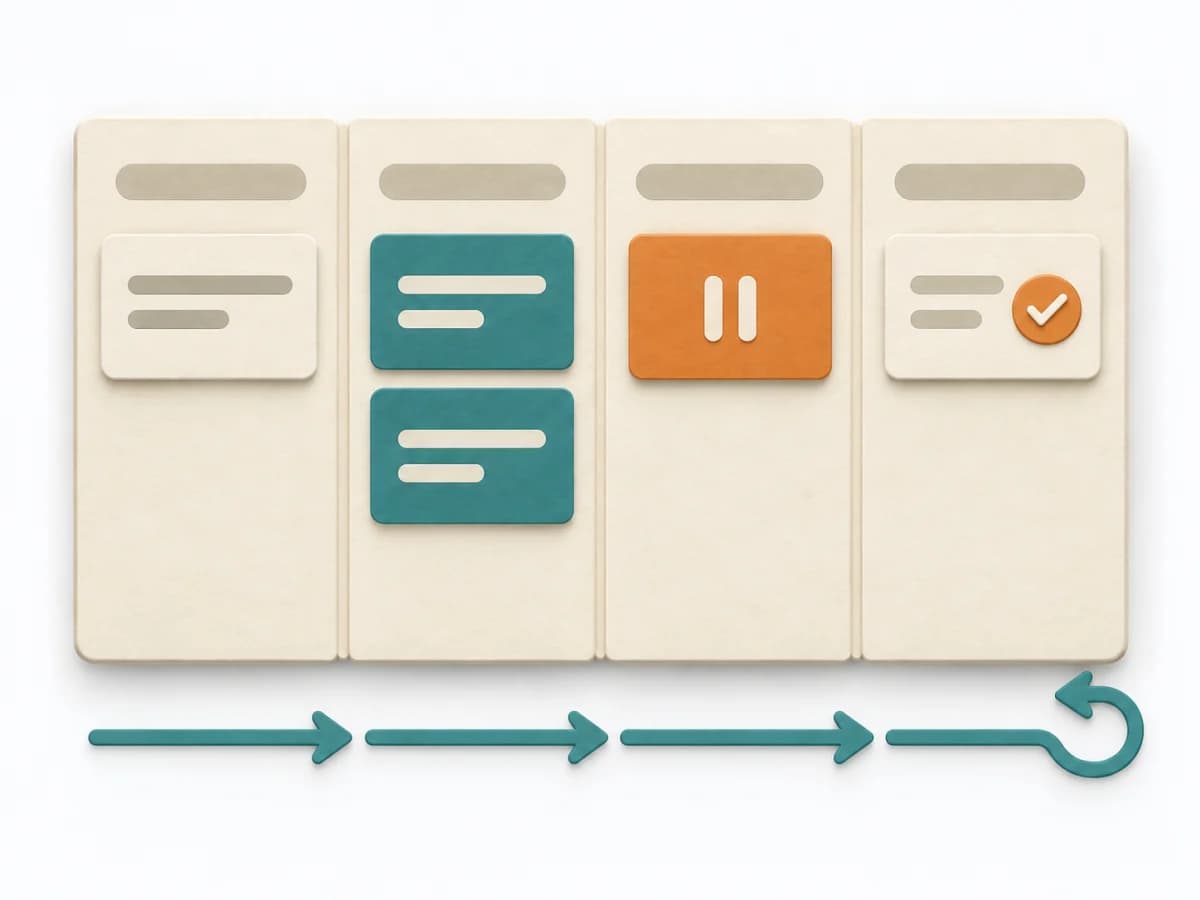 Engineering Kanban |  Operations A3 Problem Solving | 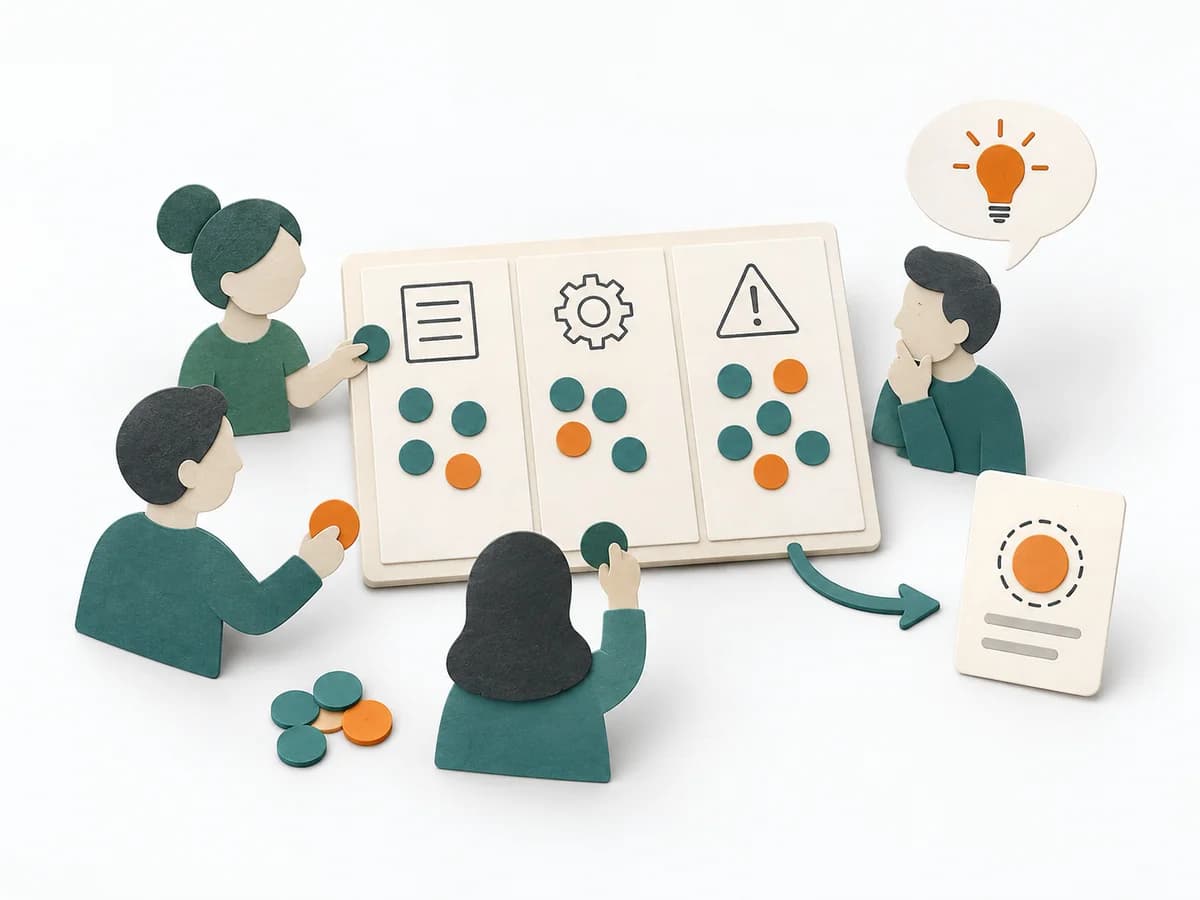 Facilitation Dot Estimation |
|---|---|---|---|---|
Purposedifferent | On complex initiatives, a plain average tends to understate just how uncertain the outcome really is. It separates options, evaluation criteria, and open risks. The result is captured as a PERT Estimate, Expected Value, and Risk Notes. | When work sits in too many parallel streams, throughput suffers and no one sees the bottlenecks. Kanban makes the flow of work visible and limits overload so a system becomes calmer and more predictable. | For a complex deviation with several people involved, the method bundles problem, analysis, and decision onto one page. It creates a shared working space where causes, countermeasures, and follow-up fit together. | When size or effort can only be estimated roughly, Dot Estimation condenses the group's experience into a quick range. It turns individual contributions into a visible selection. The result is captured as an Effort Heatmap, Risk Signals, and Discussion Targets. |
Complexitydifferent | Medium | Medium | Medium | Low |
Timedifferent | 15-45 min | Ongoing | 45-90 min | 5-20 min |
Participantsdifferent | 1-8 | 2-12 | 2-5 | 3-20 |
Formatdifferent | Workshop + async | Workshop + async | Workshop + async | Workshop |
Outputdifferent | PERT Estimate, Expected Value, Risk Notes | Kanban board, WIP policies, Flow metrics | A3 Report, Action Plan, Root Cause Analysis | Effort Heatmap, Risk Signals, Discussion Targets |
Tagsno overlap | EstimationUncertaintyRisk | FlowVisual managementDelivery | LeanProblem solvingCoachingOperations | EstimationEffortRisk |