View methods side by side.
Choose up to four methods. Add them using the search and share the comparison by copying its link.
| Criterion | 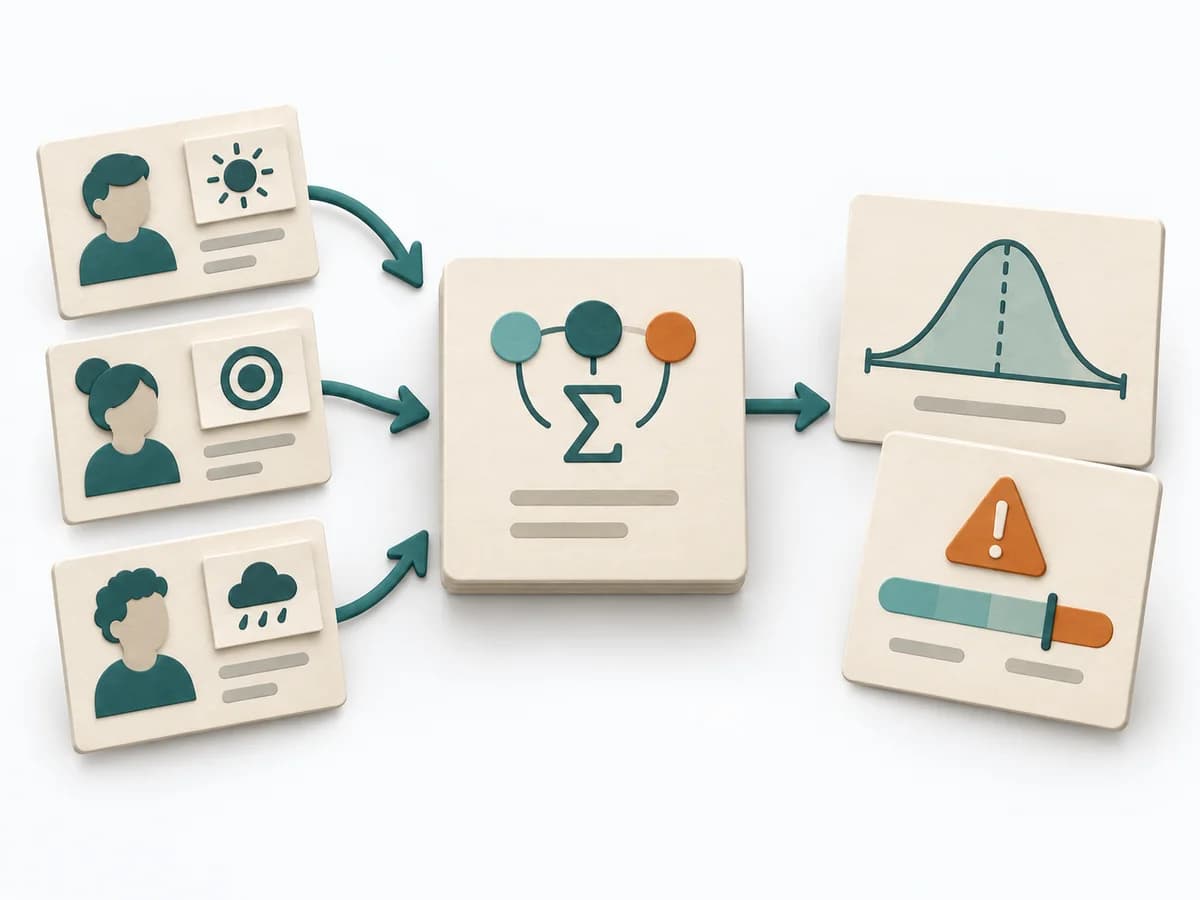 Decision Making PERT Estimation |  Facilitation Dot Estimation |  Growth Flywheel | 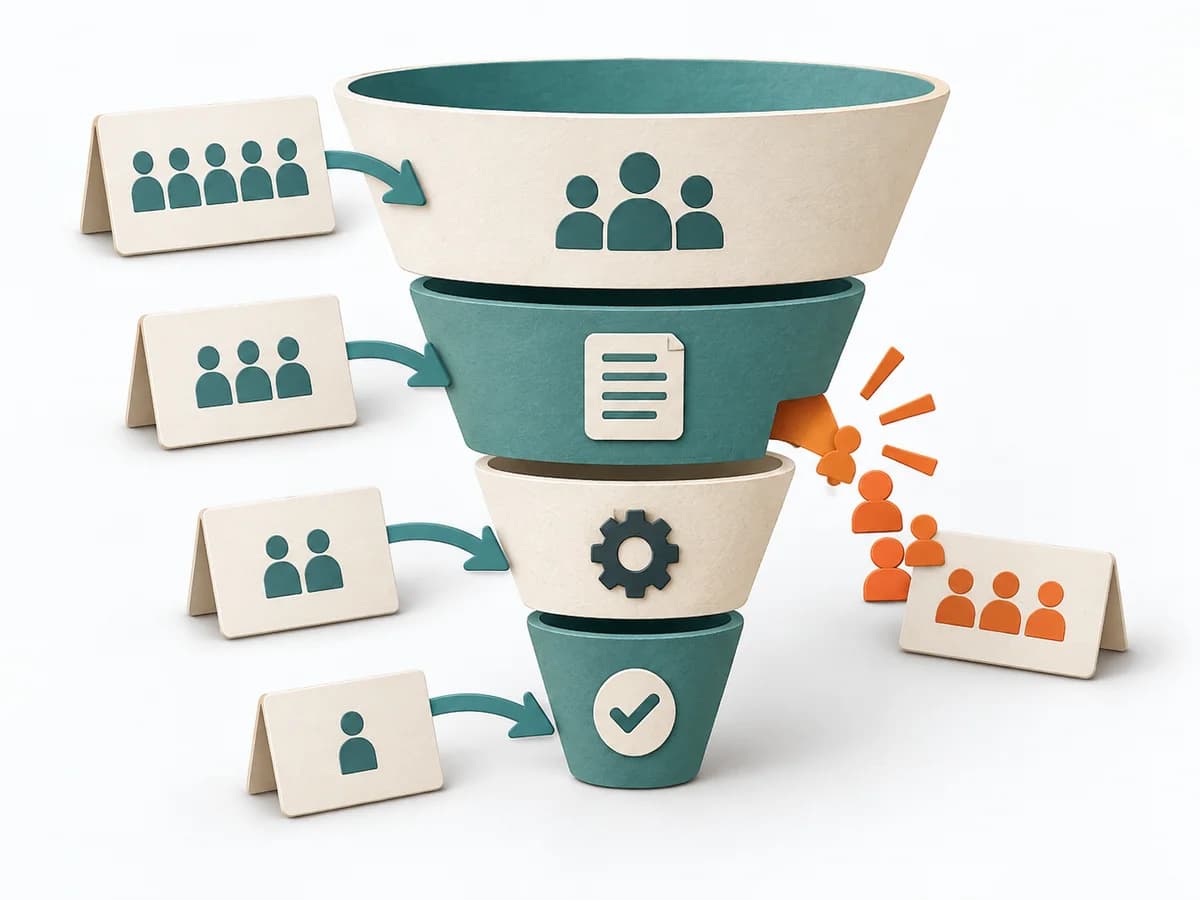 Growth Funnel Analysis |
|---|---|---|---|---|
Purposedifferent | On complex initiatives, a plain average tends to understate just how uncertain the outcome really is. It separates options, evaluation criteria, and open risks. The result is captured as a PERT Estimate, Expected Value, and Risk Notes. | When size or effort can only be estimated roughly, Dot Estimation condenses the group's experience into a quick range. It turns individual contributions into a visible selection. The result is captured as an Effort Heatmap, Risk Signals, and Discussion Targets. | Growth often breaks down where a reinforcing mechanism builds up too much friction. A Flywheel shows the cycle of value, repetition, and reinforcement meant to sustain growth. | When many visitors or users drop off along the way, the reason behind the number often stays hidden. Funnel Analysis exposes these transitions and makes visible exactly where the path collapses. |
Complexitydifferent | Medium | Low | Medium | Medium |
Timedifferent | 15-45 min | 5-20 min | 60-120 min | 1-3 h |
Participantsdifferent | 1-8 | 3-20 | 3-8 | 1-5 |
Formatdifferent | Workshop + async | Workshop | Workshop | Async |
Outputdifferent | PERT Estimate, Expected Value, Risk Notes | Effort Heatmap, Risk Signals, Discussion Targets | Flywheel Map, Friction Points, Growth Levers, Experiment Backlog | Funnel report, Drop-off analysis, Optimization hypotheses |
Tagsno overlap | EstimationUncertaintyRisk | EstimationEffortRisk | GrowthRetentionConversion | AnalyticsConversionGrowth |