View methods side by side.
Choose up to four methods. Add them using the search and share the comparison by copying its link.
| Criterion | 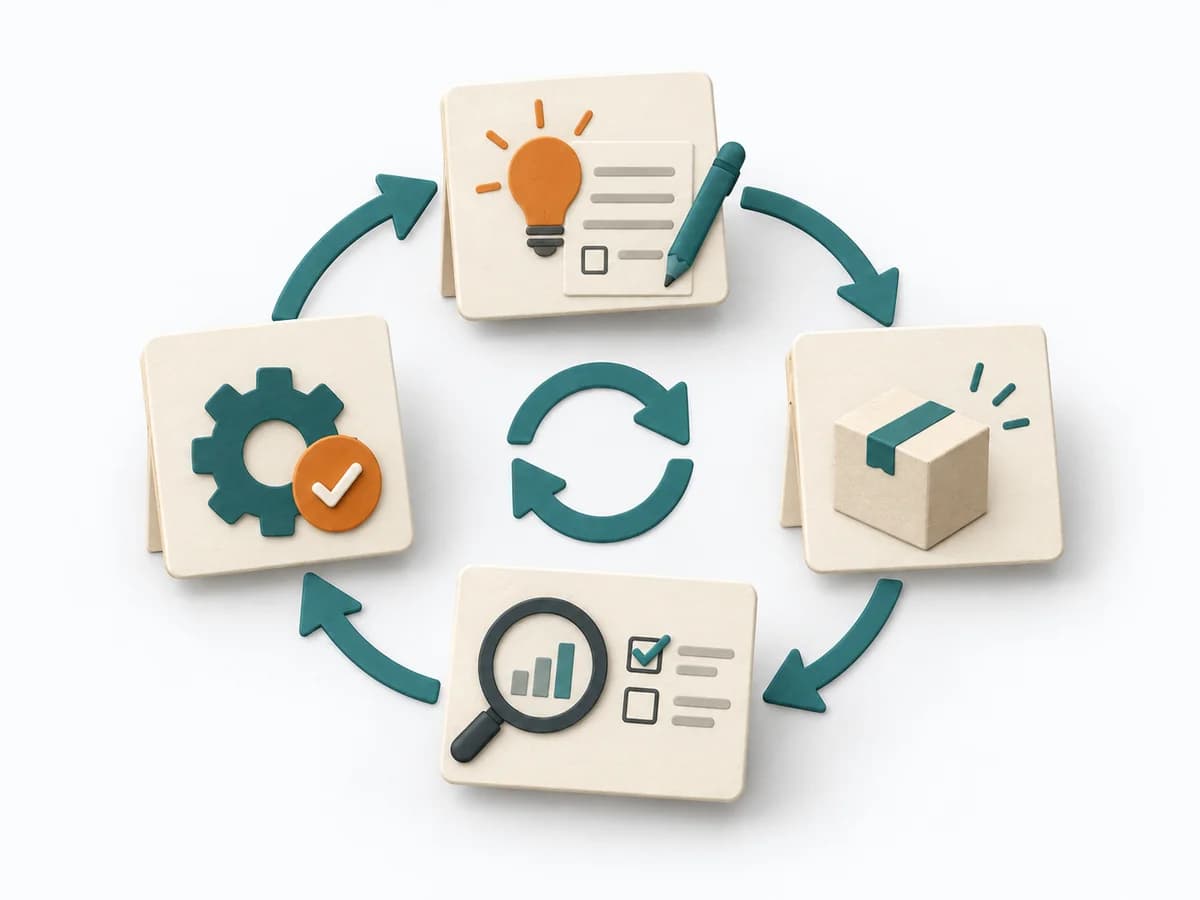 Operations PDCA Cycle | 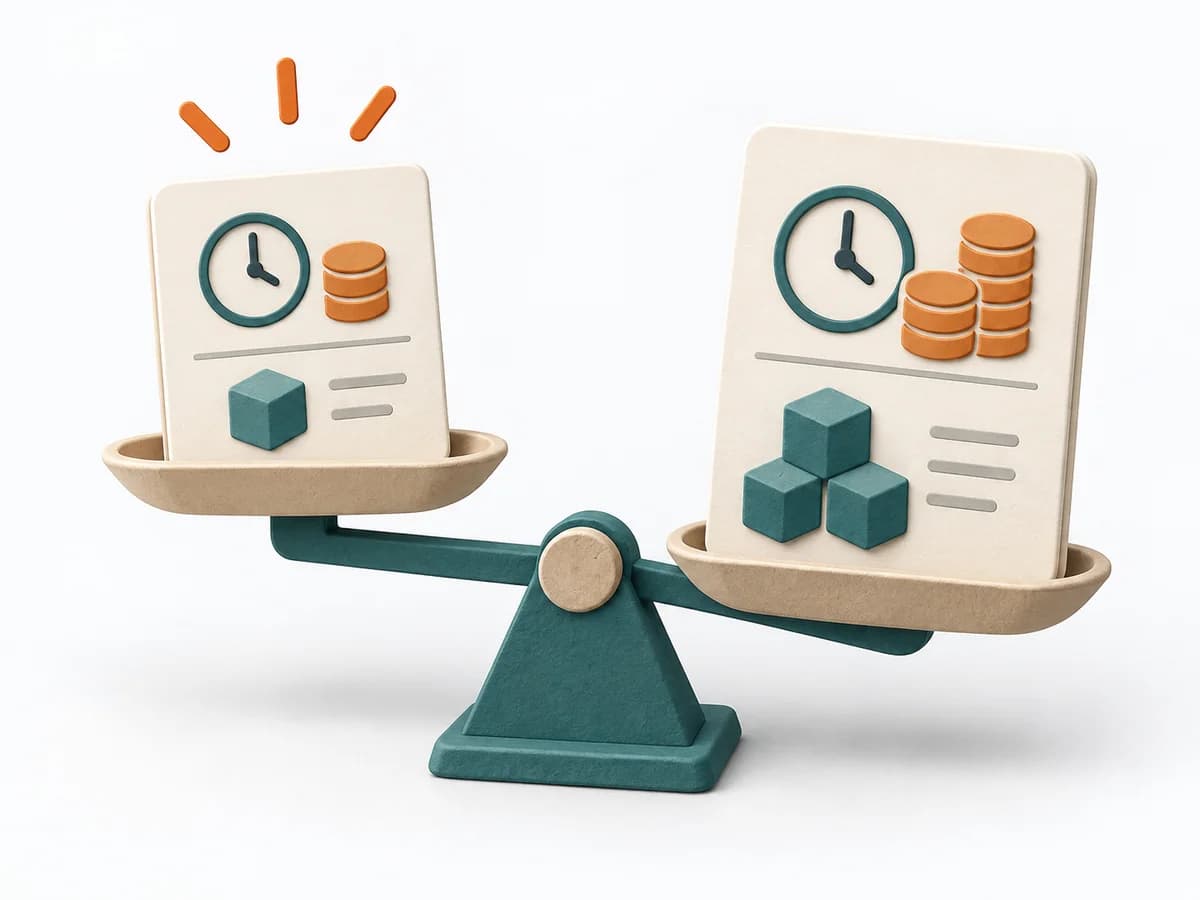 Agile WSJF | 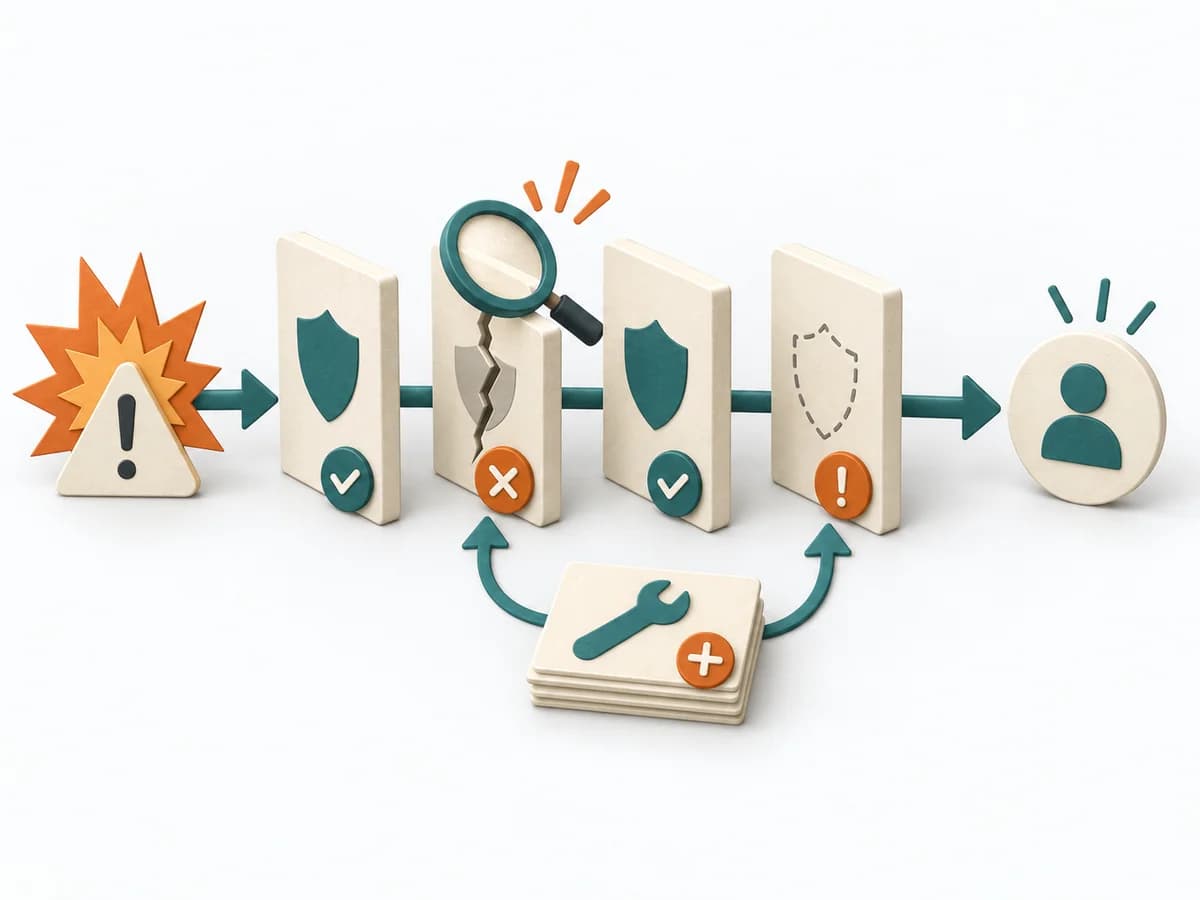 Operations Barrier Analysis | 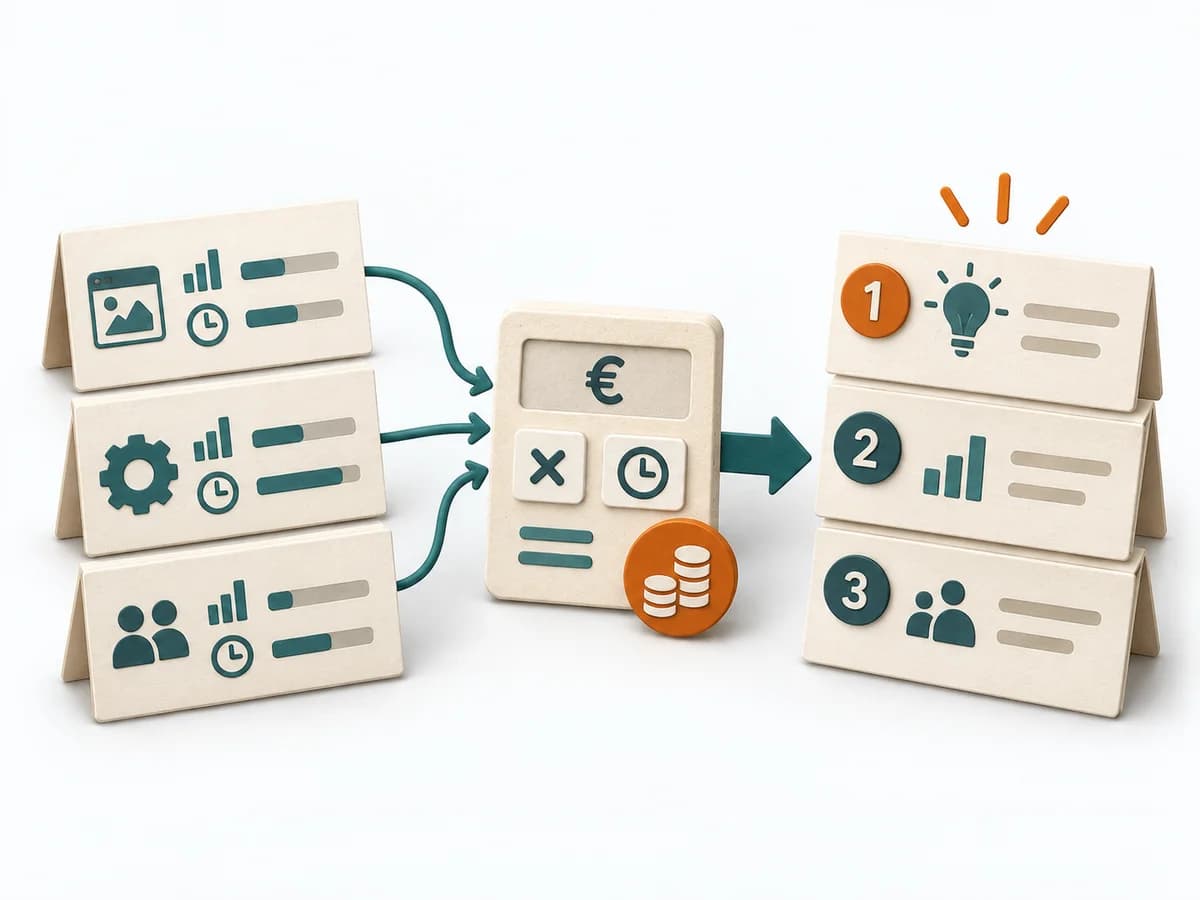 Delivery Cost of Delay |
|---|---|---|---|---|
Purposedifferent | For an improvement that still has to prove itself in everyday work, the method runs it through small learning loops. It connects planning, checking, and standardization into a repeatable learning mode. | When many tasks compete for the same capacity, it orders work by economic impact. It makes time lost, benefit, and effort comparable together. | For a risk that can only be managed through multiple layers of protection, the method examines the effectiveness of each barrier. It shows where safeguards are missing, too weak, or fail under real conditions. | Helps clarify scope, order, and delivery flow in concrete terms. It makes work, constraints, and sequence manageable. The result is captured as a Cost of Delay table and prioritization sequence. |
Complexitydifferent | Low | High | Medium | High |
Timedifferent | 1 h bis mehrere Wochen | 45-90 min | 2-4 h | 90-180 min |
Participantsdifferent | 1-8 | 3-10 | 2-6 | 3-8 |
Formatdifferent | Workshop + async | Workshop | Workshop + async | Workshop |
Outputdifferent | PDCA Log, Experiment Plan, Learning Outcome, Standard Change | Ranked Backlog, Cost-of-Delay Assumptions | Barrier Inventory, Failure Analysis per Barrier, Action Backlog | CoD Table, Prioritization Sequence |
Tagsno overlap | Continuous improvementLeanExperiments | LeanEconomicsSequencePrioritization | Root causeSafetyIncident | PrioritizationDeliveryEconomicsDecision |