View methods side by side.
Choose up to four methods. Add them using the search and share the comparison by copying its link.
| Criterion | 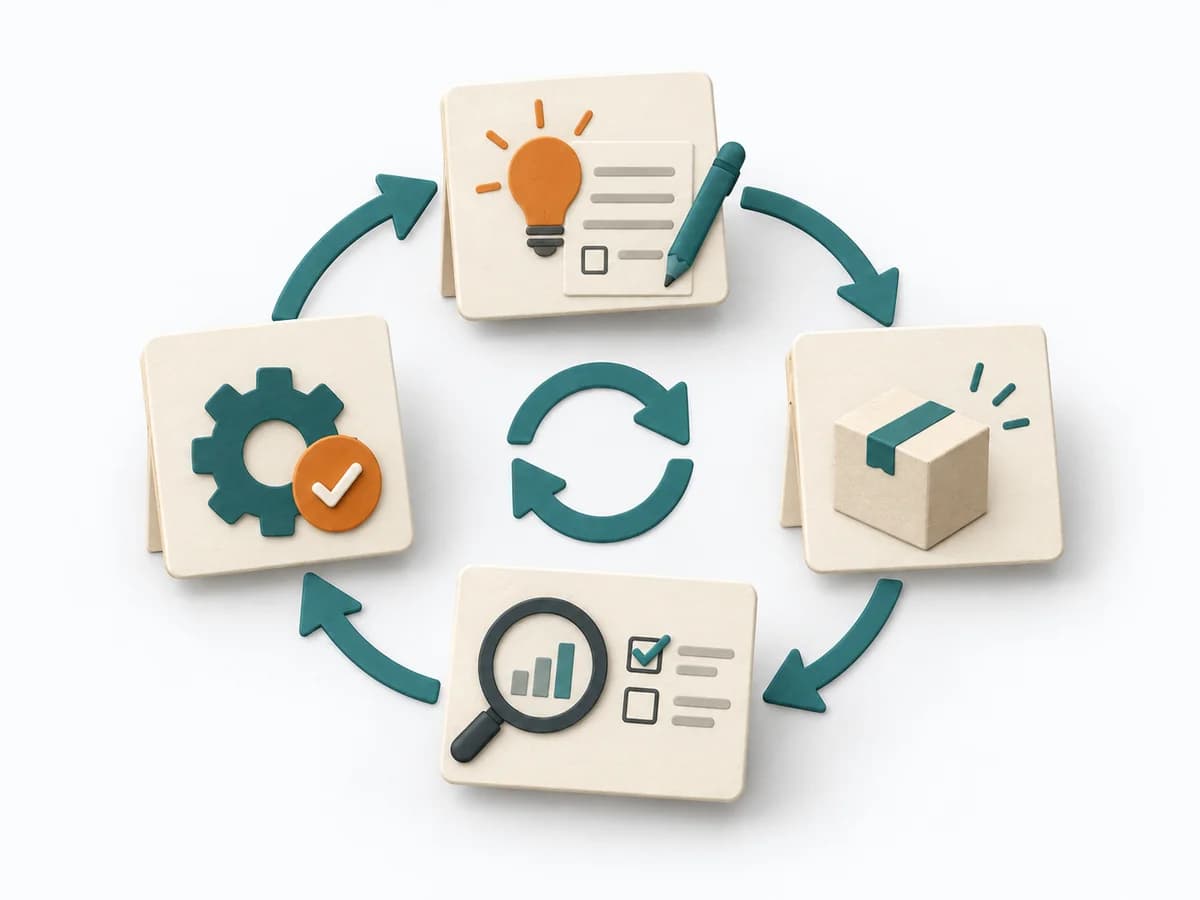 Operations PDCA Cycle |  Product Discovery Smoke Test |  Facilitation Dot Estimation |  Product Discovery Assumption Mapping |
|---|---|---|---|---|
Purposedifferent | For an improvement that still has to prove itself in everyday work, the method runs it through small learning loops. It connects planning, checking, and standardization into a repeatable learning mode. | When demand only needs to be roughly verified, it tests interest with minimal effort. It measures whether people would take a next step at all. | When size or effort can only be estimated roughly, Dot Estimation condenses the group's experience into a quick range. It turns individual contributions into a visible selection. The result is captured as an Effort Heatmap, Risk Signals, and Discussion Targets. | When assumptions still sit unordered in the room, it weighs uncertainty against leverage. It makes visible which hypotheses should be checked first. |
Complexitydifferent | Low | Low | Low | Medium |
Timedifferent | 1 h bis mehrere Wochen | 1-5 Tage | 5-20 min | 45-60 min |
Participantsdifferent | 1-8 | Nutzertraffic | 3-20 | 2-8 |
Formatdifferent | Workshop + async | Async | Workshop | Workshop + async |
Outputdifferent | PDCA Log, Experiment Plan, Learning Outcome, Standard Change | Interest Metrics, Conversion Signal, Learning Note | Effort Heatmap, Risk Signals, Discussion Targets | Assumption map, Test backlog, Risk ranking |
Tagsno overlap | Continuous improvementLeanExperiments | ValidationExperimentsDemandGrowth | EstimationEffortRisk | AssumptionsRiskExperimentsValidation |