View methods side by side.
Choose up to four methods. Add them using the search and share the comparison by copying its link.
| Criterion | 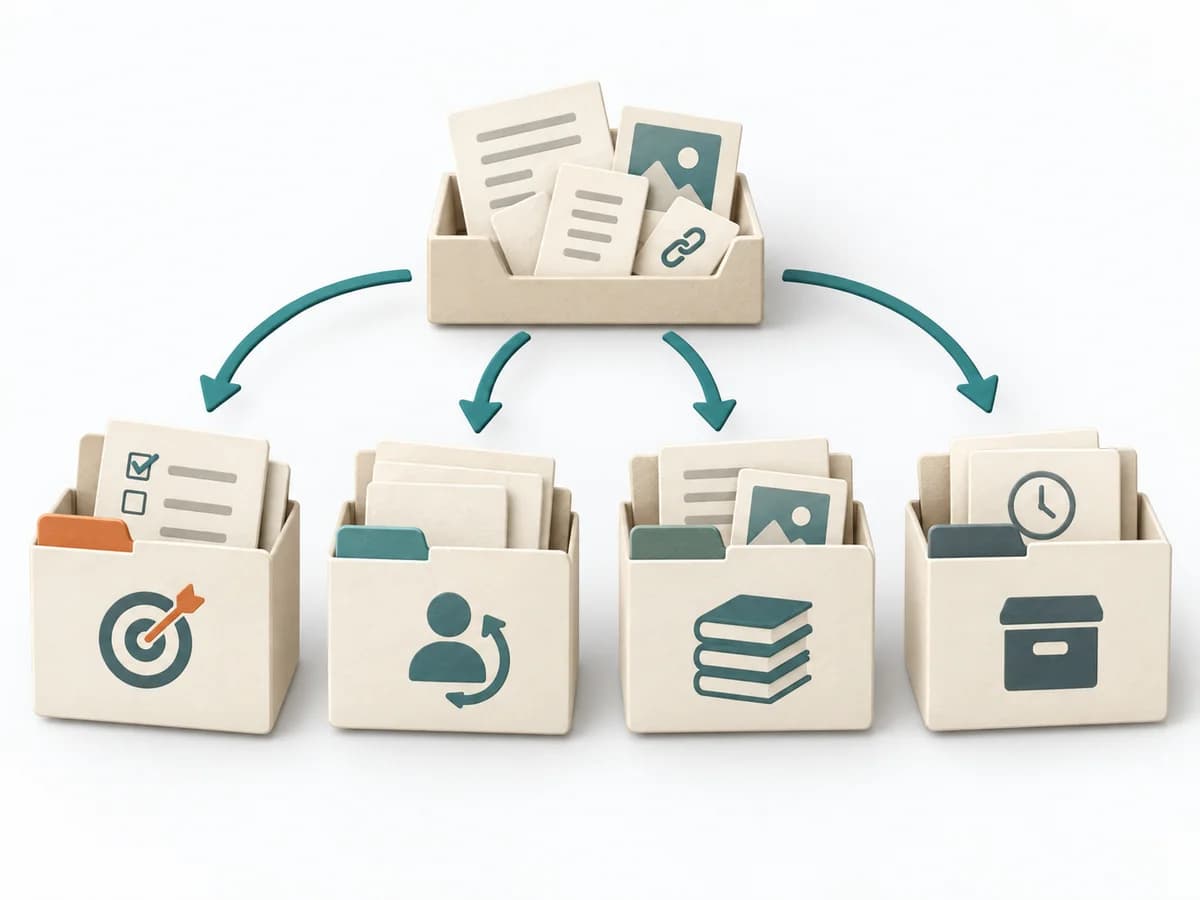 Knowledge Modeling PARA Method |  Growth Pirate Metrics AARRR |  Business Strategy Balanced Scorecard | 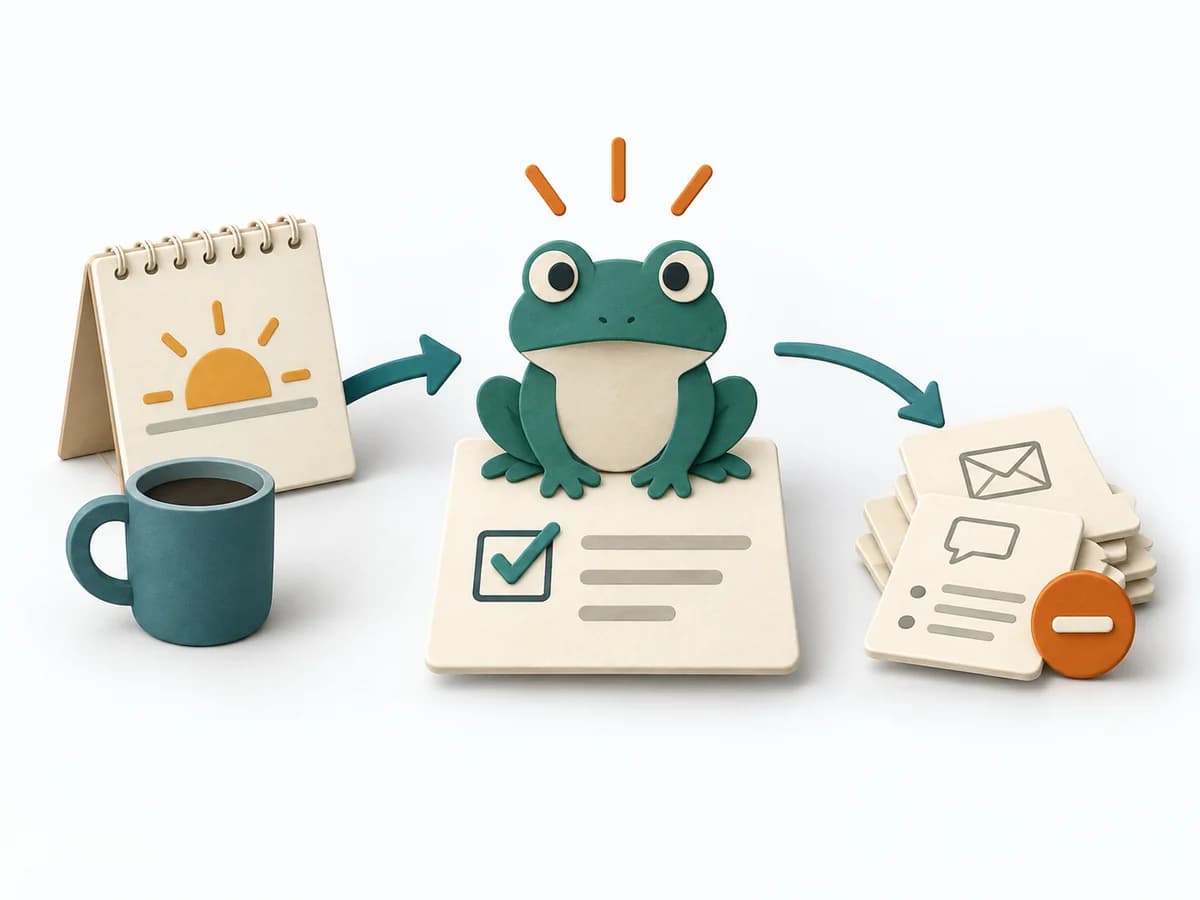 Operations Eat the Frog |
|---|---|---|---|---|
Purposedifferent | The PARA Method organizes knowledge into Projects, Areas, Resources, and Archives. It creates order when digital notes, files, and tasks no longer cleanly fit current work. | For products with complex usage paths, overall growth alone is too coarse to reveal bottlenecks. Pirate Metrics breaks the relationship with the product into consecutive stages and shows where the funnel actually leaks. | Balanced Scorecard translates strategy into a few interconnected perspectives and metrics. It holds impact, steering, and learning together in daily work instead of narrowing strategy down to financial figures. | The method protects energy and attention for the task that creates the largest progress and is often postponed. |
Complexitydifferent | Medium | Medium | High | Low |
Timedifferent | 1-3 h Setup, laufend | 1-2 h Setup, laufend | Halber Tag bis mehrere Wochen | 15-90 min daily |
Participantsdifferent | 1 | 2-8 | 4-12 | 1 |
Formatdifferent | Async | Workshop + async | Workshop + async | Async |
Outputdifferent | PARA Structure, Project Notes, Knowledge Archive | AARRR funnel, Metric baseline, Experiment backlog | Balanced Scorecard, Strategic Measures, Initiative Map | Priority Task, Completion Note, Daily Focus |
Tagsno overlap | KnowledgeProductivityOrganization | GrowthMetricsExperiments | StrategyMetricsExecution | PrioritizationProductivityFocusExecution |