View methods side by side.
Choose up to four methods. Add them using the search and share the comparison by copying its link.
| Criterion | 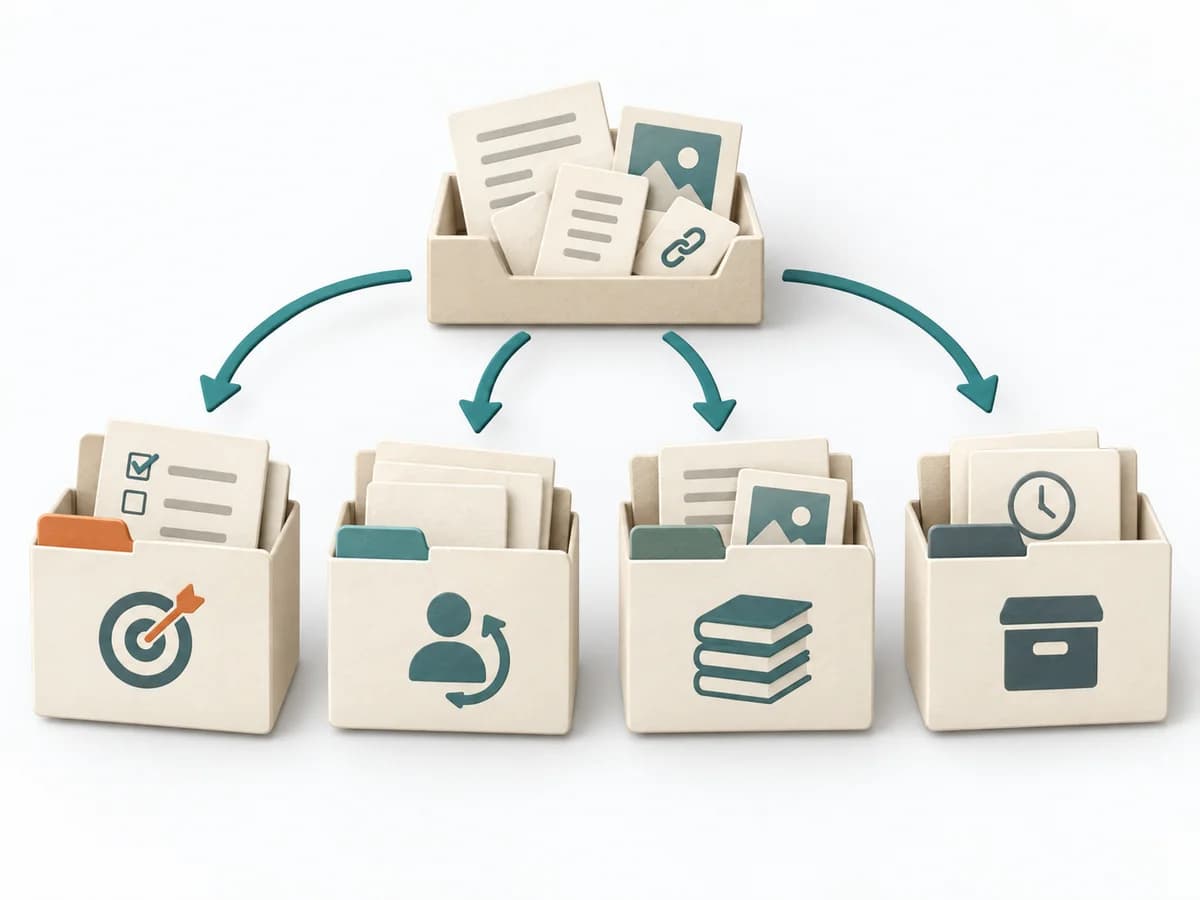 Knowledge Modeling PARA Method |  Growth Pirate Metrics AARRR | 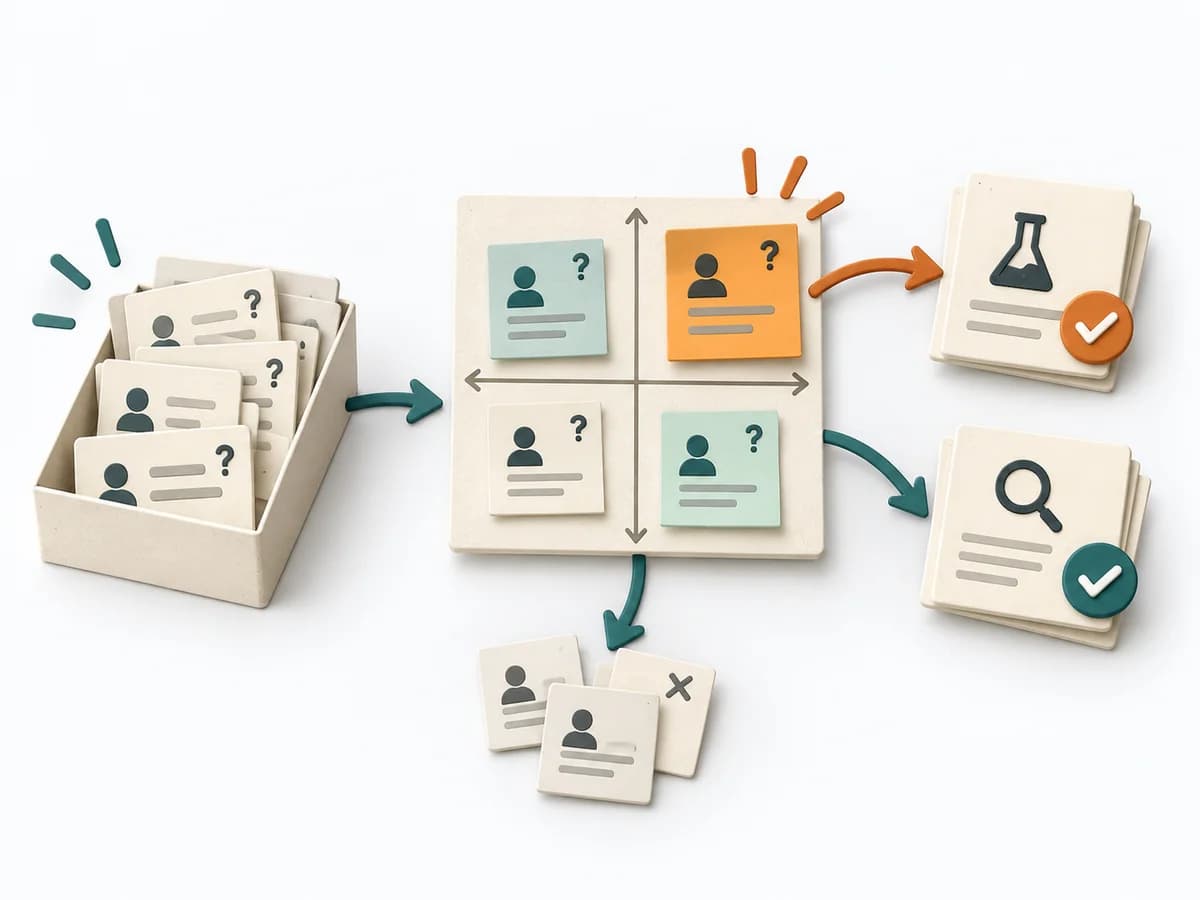 Decision Making Assumption Surfacing |  Growth A/B Testing |
|---|---|---|---|---|
Purposedifferent | The PARA Method organizes knowledge into Projects, Areas, Resources, and Archives. It creates order when digital notes, files, and tasks no longer cleanly fit current work. | For products with complex usage paths, overall growth alone is too coarse to reveal bottlenecks. Pirate Metrics breaks the relationship with the product into consecutive stages and shows where the funnel actually leaks. | Plans often contain assumptions that were never openly stated and remain dangerous precisely because of that. Assumption Surfacing makes these silent premises visible and prioritizes which of them carry the initiative or could sink it. | When two variants compete, discussions quickly decide by taste rather than effect. A/B Testing checks behavior under controlled conditions and separates real improvement from chance or expectation effects. |
Complexitydifferent | Medium | Medium | Low | High |
Timedifferent | 1-3 h Setup, laufend | 1-2 h Setup, laufend | 45-90 min | 1-4 Wochen |
Participantsdifferent | 1 | 2-8 | 2-8 | 1-6 |
Formatdifferent | Async | Workshop + async | Workshop + async | Async |
Outputdifferent | PARA Structure, Project Notes, Knowledge Archive | AARRR funnel, Metric baseline, Experiment backlog | Assumption List, Critical Assumptions, Learning Plan | Experiment results, Decision log, Learning summary |
Tagsno overlap | KnowledgeProductivityOrganization | GrowthMetricsExperiments | AssumptionsRiskDecisionDiscovery | ExperimentsGrowthAnalyticsValidation |