View methods side by side.
Choose up to four methods. Add them using the search and share the comparison by copying its link.
| Criterion | 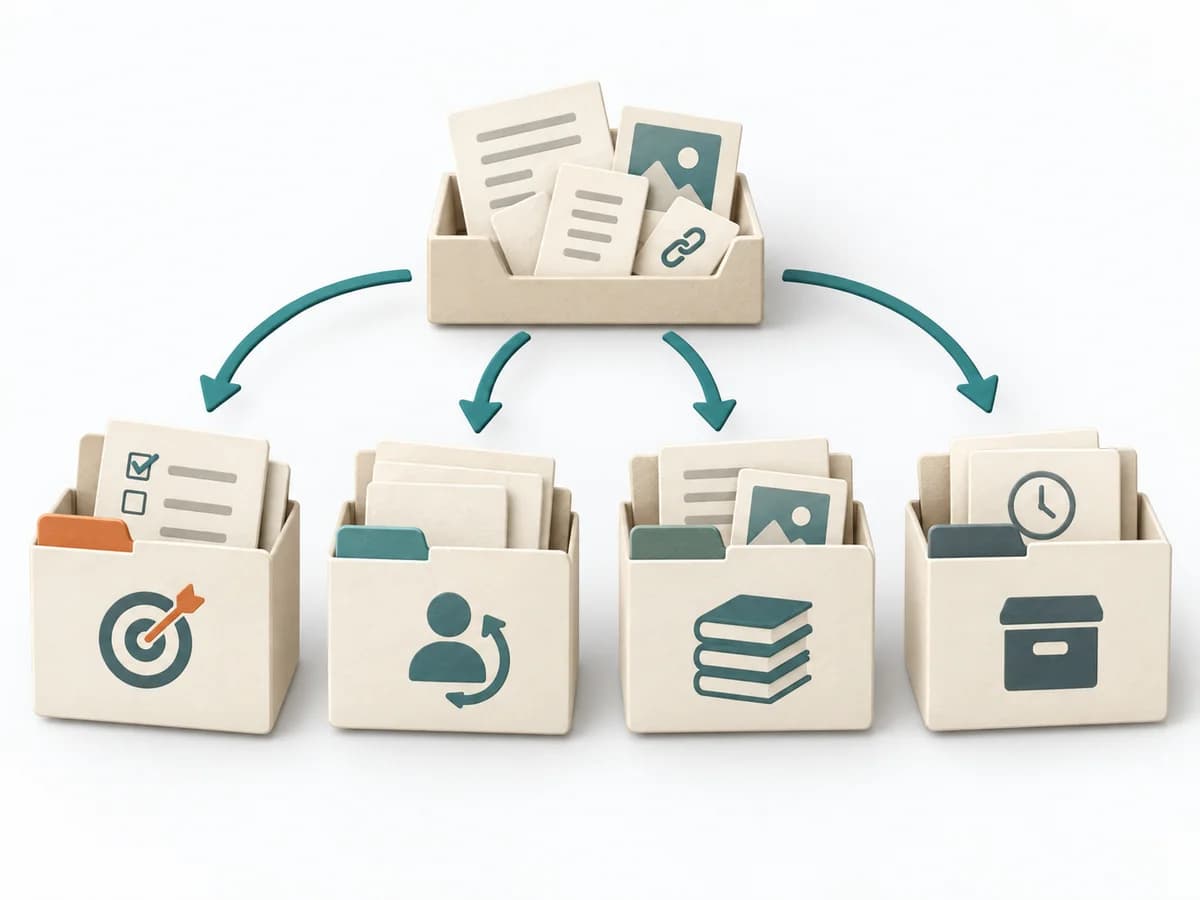 Knowledge Modeling PARA Method | 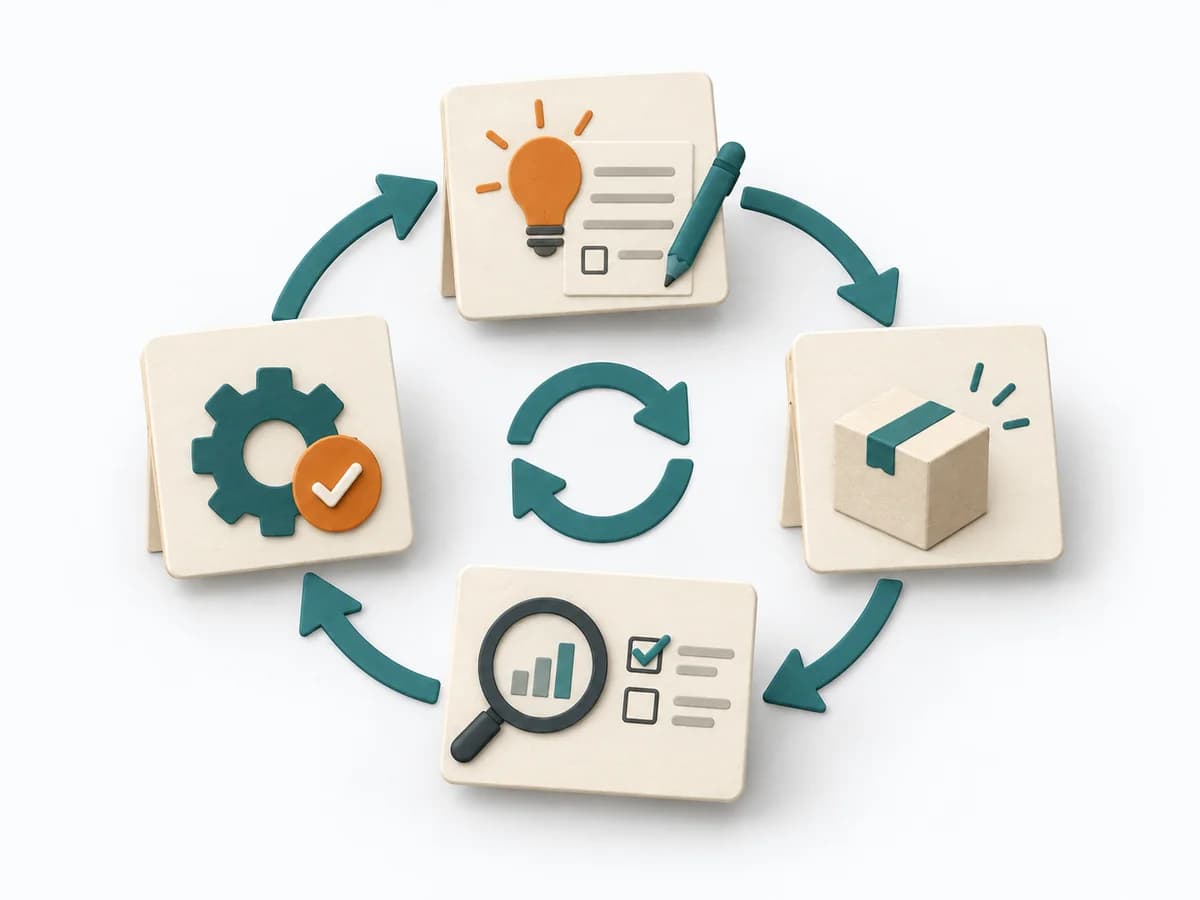 Operations PDCA Cycle | 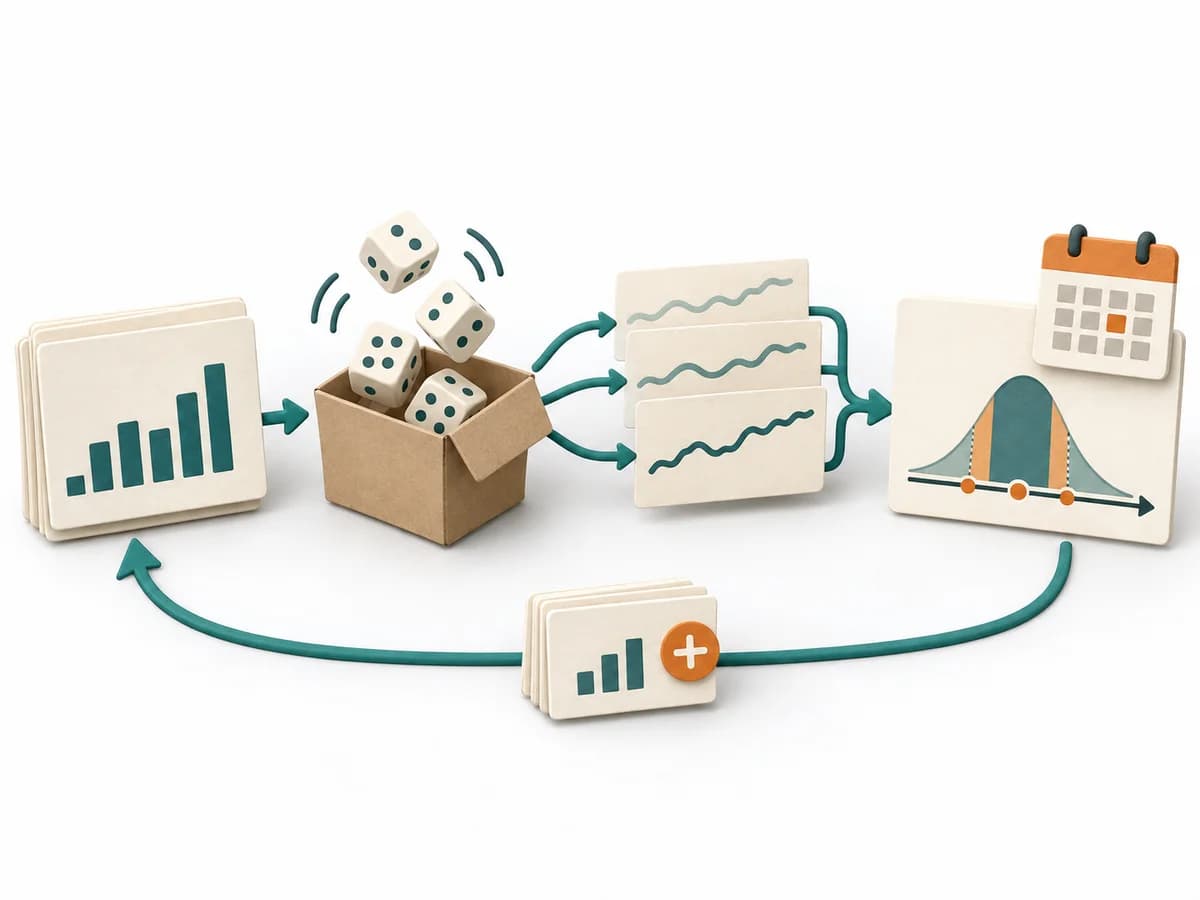 Delivery Monte Carlo Forecasting | 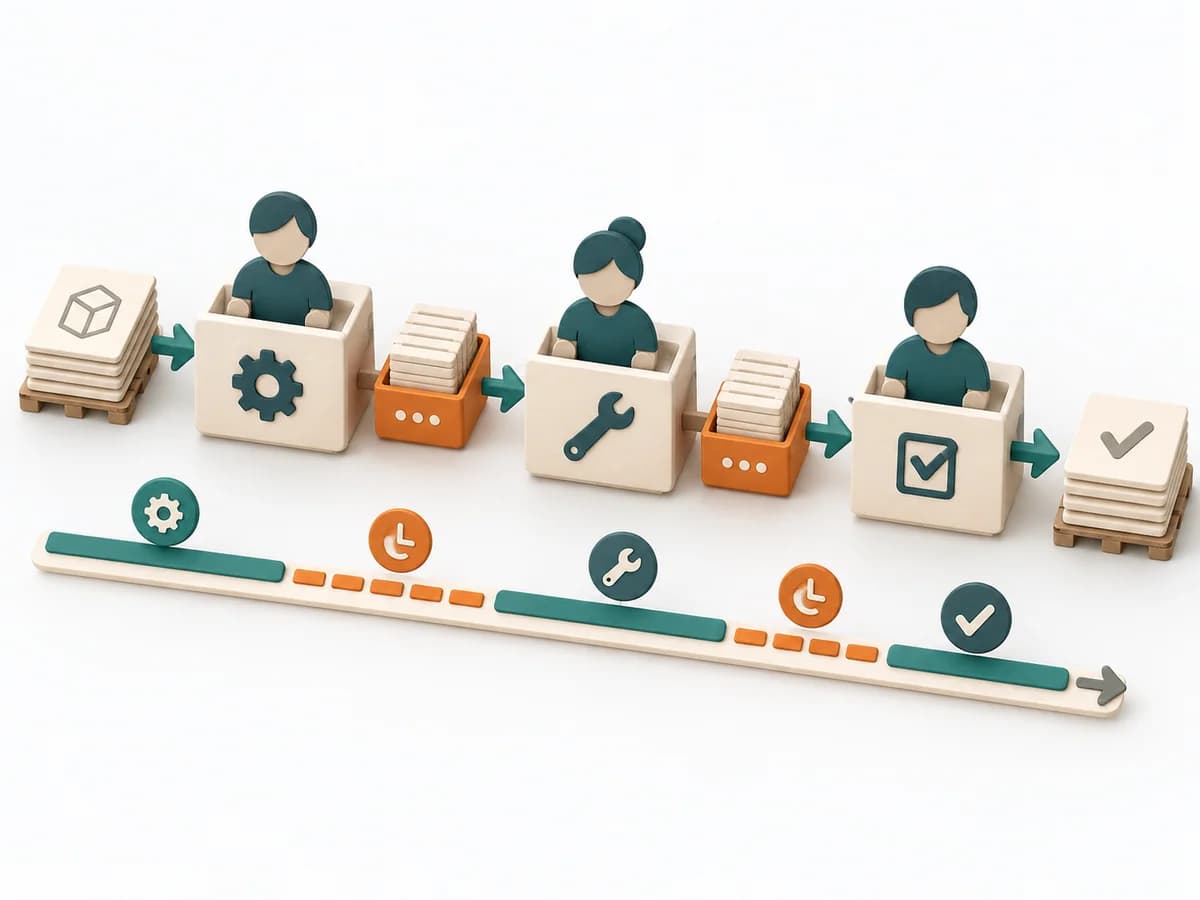 Delivery Value Stream Mapping |
|---|---|---|---|---|
Purposedifferent | The PARA Method organizes knowledge into Projects, Areas, Resources, and Archives. It creates order when digital notes, files, and tasks no longer cleanly fit current work. | For an improvement that still has to prove itself in everyday work, the method runs it through small learning loops. It connects planning, checking, and standardization into a repeatable learning mode. | Helps clarify scope, sequence, and delivery flow in concrete terms. It makes work, boundaries, and order steerable. The result is captured as Forecast Percentiles, Throughput Dataset, and Risk Communication. | When delivery work dissolves into wait times, handoffs, and hidden effort, Value Stream Mapping makes the actual flow visible. The method exposes bottlenecks, idle time, and feedback loops so lead time and improvement levers become tangible. |
Complexitydifferent | Medium | Low | High | Medium |
Timedifferent | 1-3 h Setup, laufend | 1 h bis mehrere Wochen | 30-90 min Setup, danach laufend | 1-3 h |
Participantsdifferent | 1 | 1-8 | 1-8 | 4-10 |
Formatdifferent | Async | Workshop + async | Workshop + async | Workshop |
Outputdifferent | PARA Structure, Project Notes, Knowledge Archive | PDCA Log, Experiment Plan, Learning Outcome, Standard Change | Forecast Percentiles, Throughput Dataset, Risk Communication | Current-state map, Future-state map, Bottleneck list |
Tagsno overlap | KnowledgeProductivityOrganization | Continuous improvementLeanExperiments | ForecastingFlowDelivery | LeanFlowWasteDelivery |