View methods side by side.
Choose up to four methods. Add them using the search and share the comparison by copying its link.
| Criterion |  Product Strategy OKRs | 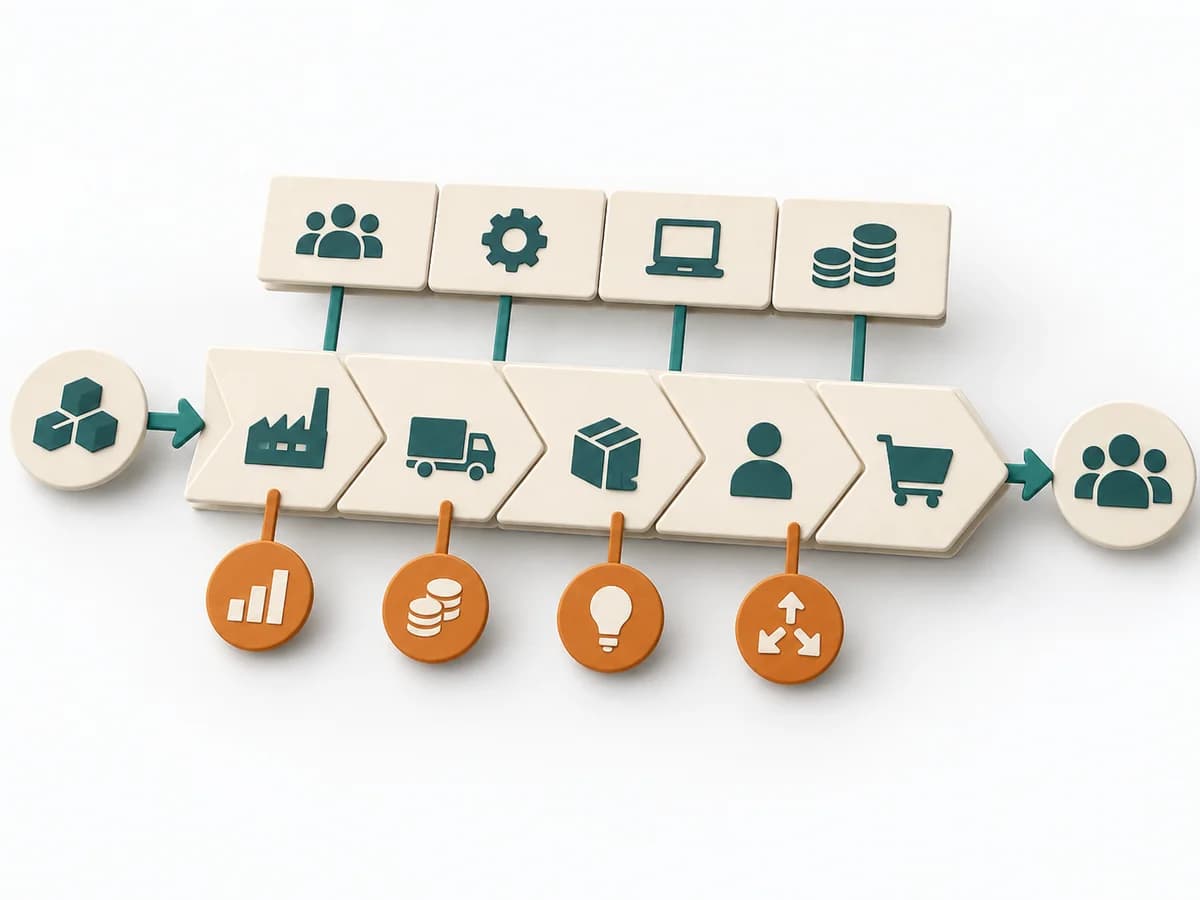 Business Strategy Value Chain Analysis |  Product Strategy SMART Goals |  Business Strategy GAP Analysis |
|---|---|---|---|---|
Purposedifferent | When strategic direction needs to become measurable, it connects ambition with checkable results. It makes goals connectable to focus and review. | Value Chain Analysis shows where value is created, costs accrue, and differentiation becomes possible along the process. It compares strengths, risks, market logic, and courses of action. The result is captured as a value-chain map and lever list. | When goals are formulated too generally, it brings measurability, direction, and timing into shape. It prevents intentions from staying without clear verification. | GAP Analysis compares the current state with a target picture and makes the distance manageable. It becomes useful when, ahead of new initiatives, it must become clear which capabilities, processes, or resources are missing. |
Complexitydifferent | Medium | High | Low | Medium |
Timedifferent | 1-2 h Setup | Half day | 15-30 min | 1-3 h |
Participantsdifferent | 2-20 | 3-8 | 1-8 | 2-8 |
Formatdifferent | Workshop + async | Workshop | Workshop + async | Workshop + async |
Outputdifferent | OKR set, Measurement plan, Review cadence | Value Chain Map, Lever List | SMART Goal, Measurement Note, Deadline | Gap Matrix, Action Plan, Risk Notes |
Tagsno overlap | GoalsAlignmentOutcomesMeasurement | StrategyBusiness modelDiagnosisAnalysis | GoalsPlanningMeasurementAlignment | StrategyAnalysisPlanning |