View methods side by side.
Choose up to four methods. Add them using the search and share the comparison by copying its link.
| Criterion | 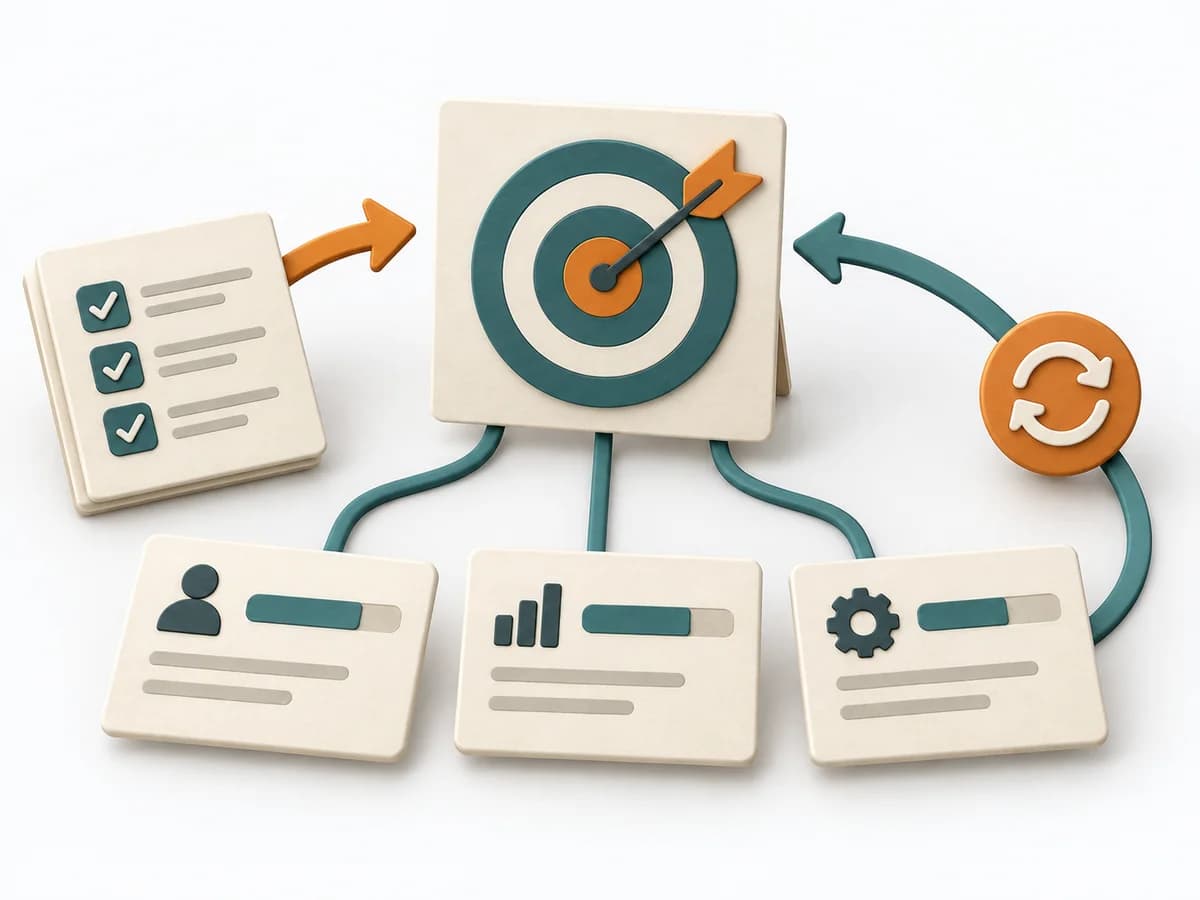 Product Strategy OKRs | 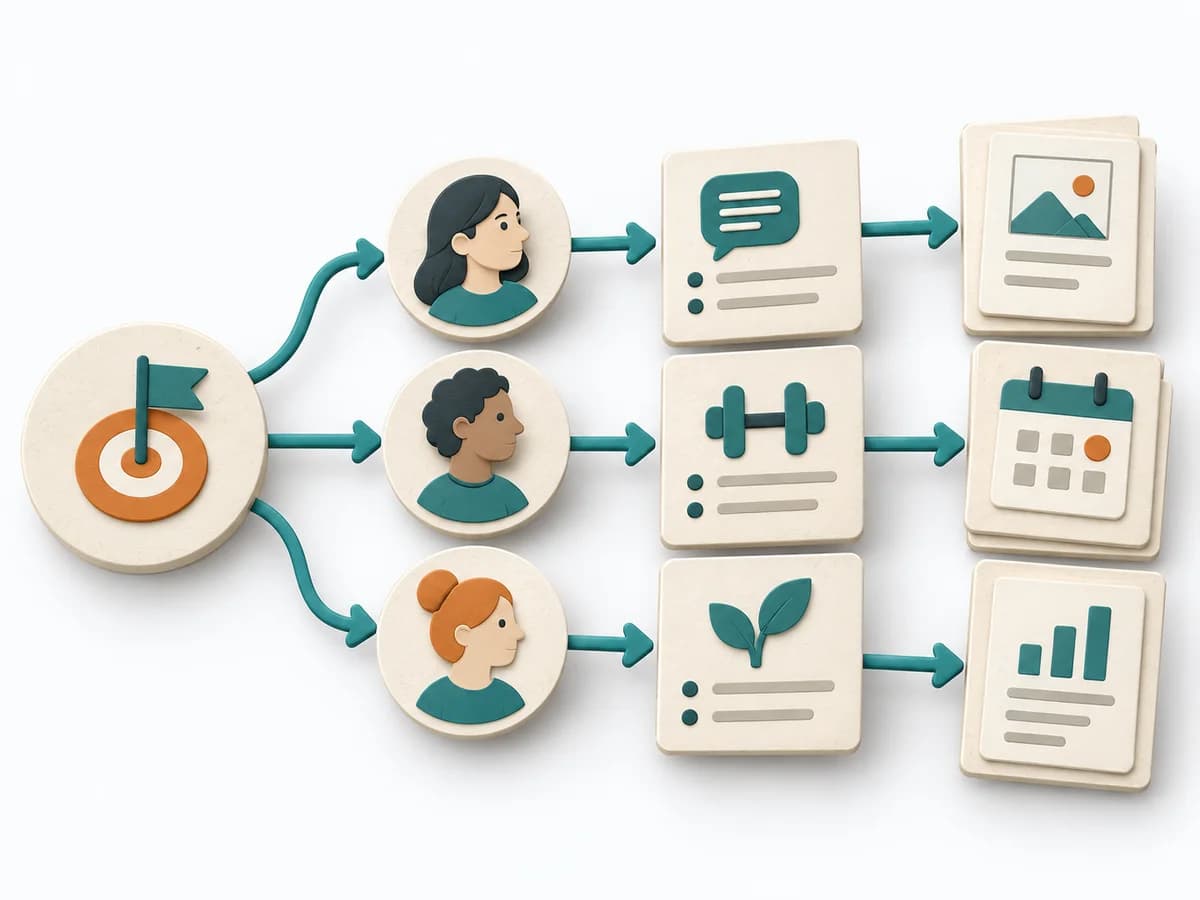 Product Strategy Impact Mapping | 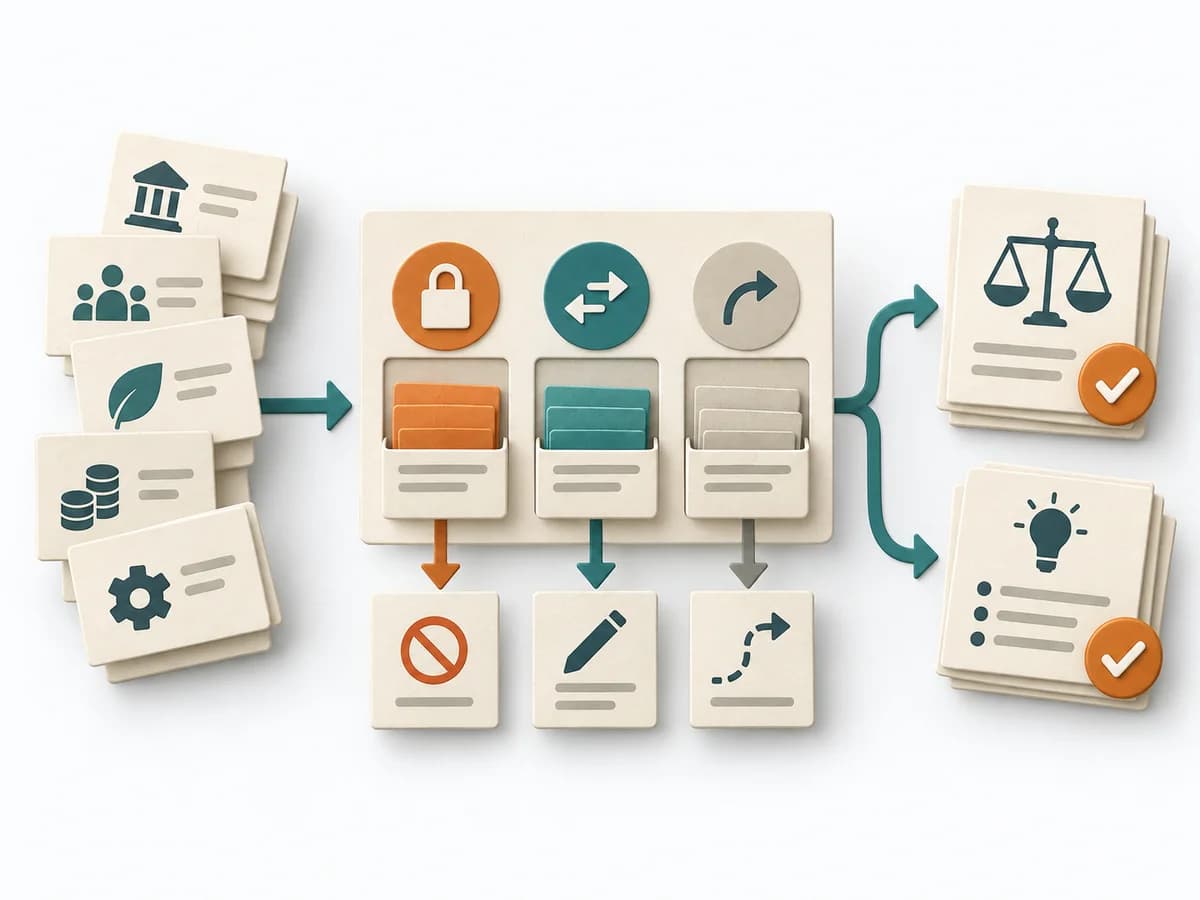 Decision Making Constraint Analysis | 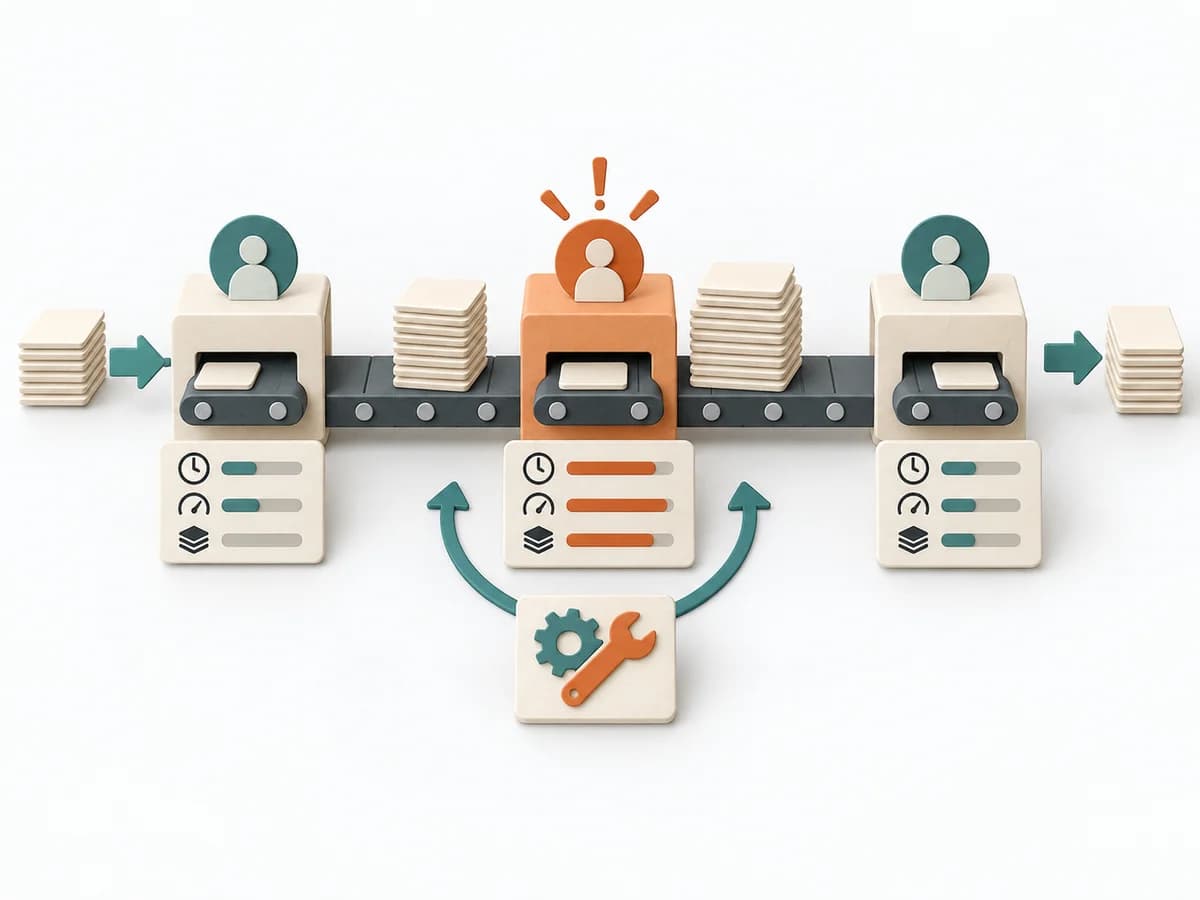 Operations Bottleneck Analysis |
|---|---|---|---|---|
Purposedifferent | When strategic direction needs to become measurable, it connects ambition with checkable results. It makes goals connectable to focus and review. | When a goal needs to be connected to several possible paths, it shows chains of impact instead of feature lists. It connects business goal, behavior change, and measures. | When an initiative stalls, the limit often lies not in the idea but in hard or soft boundary conditions. Constraint Analysis separates these limits and shows which of them can actually be shaped. | For a flow that backs up at one point, the method looks for the capacity limit with the greatest leverage. It explains why extra effort elsewhere barely improves throughput. |
Complexitydifferent | Medium | Medium | Low | Medium |
Timedifferent | 1-2 h Setup | 45-90 min | 30-90 min | 1-3 h |
Participantsdifferent | 2-20 | 3-8 | 2-8 | 3-8 |
Formatdifferent | Workshop + async | Workshop | Workshop + async | Workshop + async |
Outputdifferent | OKR set, Measurement plan, Review cadence | Impact Map, Outcome Hypotheses, Delivery Options | Constraint List, Hard/Soft Classification, Option Impact Notes, Decision Boundaries | Bottleneck Map, Flow Metrics, Improvement Options, Follow-up Measures |
Tagsno overlap | GoalsAlignmentOutcomesMeasurement | OutcomesStrategyBehaviorPlanning | ConstraintsDecisionPlanningOptions | FlowMeasurementConstraints |