View methods side by side.
Choose up to four methods. Add them using the search and share the comparison by copying its link.
| Criterion | 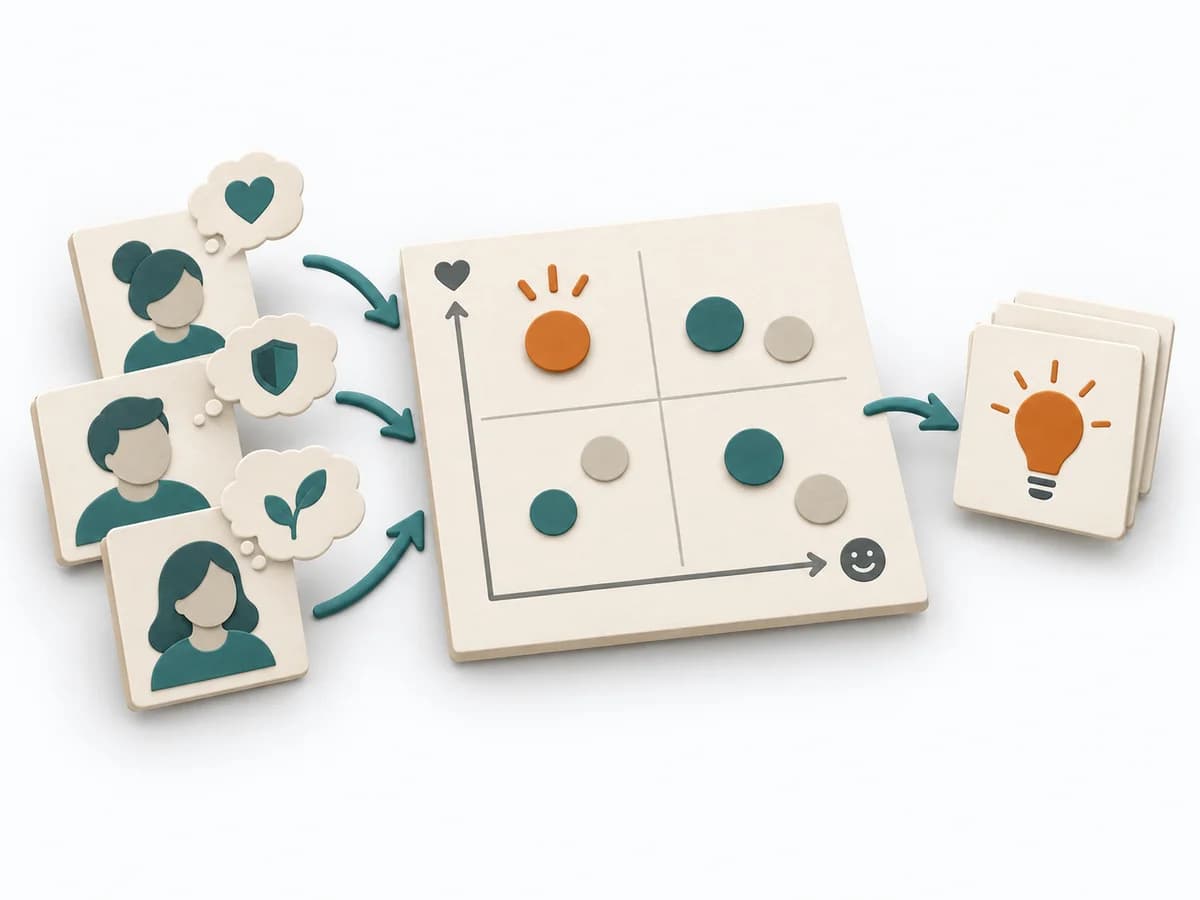 Product Discovery Outcome-Driven Innovation | 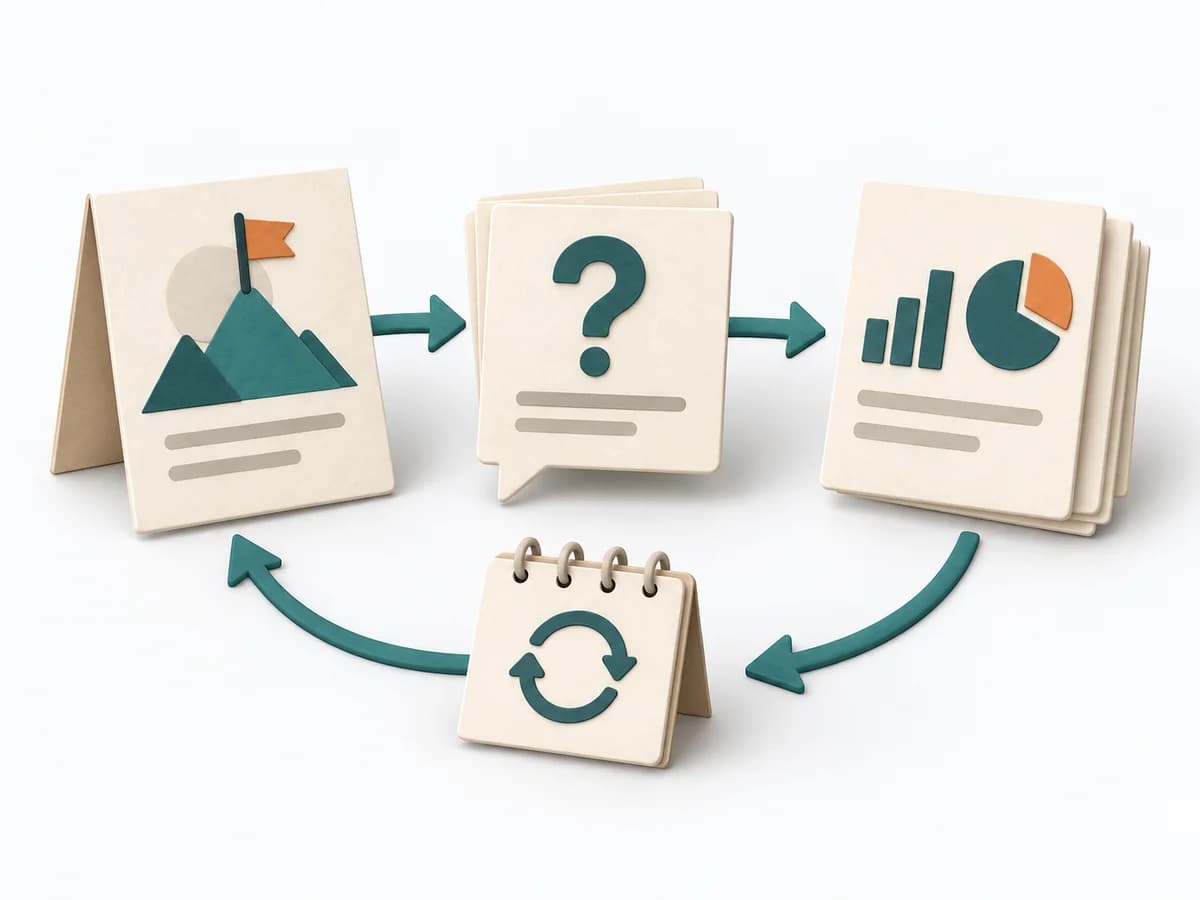 Engineering Goal Question Metric |
|---|---|---|
Purposedifferent | Outcome-Driven Innovation clarifies customer problems, solution opportunities, and evidence. It separates jobs, desired outcomes, importance, satisfaction, and opportunity, and captures results as desired outcome statements, an opportunity landscape, and segments by underserved needs. | Helps clarify technical problems, hypotheses, and next steps in concrete terms. It breaks a technical problem into testable parts. The result is captured as a GQM table and metric briefs. |
Complexitydifferent | High | Medium |
Timedifferent | Mehrere Wochen | 90-180 min |
Participantsdifferent | 2-6 researchers plus sample | 3-6 |
Formatdifferent | Workshop + async | Workshop |
Outputdifferent | Desired outcome statements, Opportunity landscape, Segmentation by underserved needs, Innovation hypotheses | GQM Table, Metric Profiles |
Tagsno overlap | OutcomesInnovationResearchQuantitative | MetricsMeasurementEngineeringAlignment |
Often compared together
Methods with strong topical overlap with the current selection, not yet in the comparison.