View methods side by side.
Choose up to four methods. Add them using the search and share the comparison by copying its link.
| Criterion |  Growth North Star Metric | 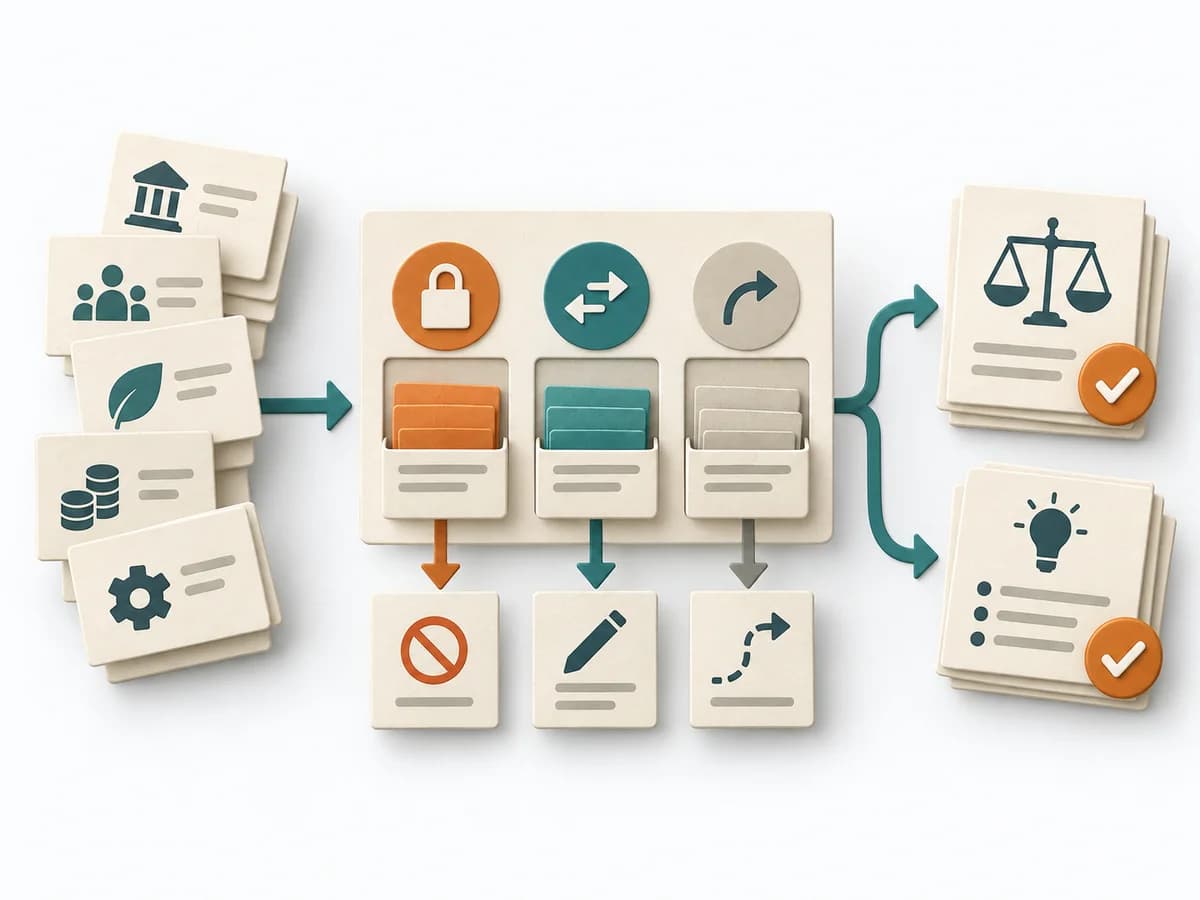 Decision Making Constraint Analysis |  Decision Making DACI |  Decision Making RAPID |
|---|---|---|---|---|
Purposedifferent | When product teams track many metrics, the view of the actual customer outcome easily gets lost. A North Star Metric bundles growth, usage, and value contribution into one signal that makes the system's direction visible. | When an initiative stalls, the limit often lies not in the idea but in hard or soft boundary conditions. Constraint Analysis separates these limits and shows which of them can actually be shaped. | In cross-functional decisions, responsibilities quickly blur between approval, influence, and execution. DACI arranges these roles so decision pressure, contribution, and information stay cleanly separated. | In complex management decisions, clarity is often missing about who recommends, who agrees, and who makes the decision. RAPID creates this assignment and stabilizes decisions across several levels. |
Complexitydifferent | Medium | Low | Low | Medium |
Timedifferent | 1-2 h | 30-90 min | 30-60 min | 45-90 min |
Participantsdifferent | 3-8 | 2-8 | 2-10 | 3-12 |
Formatsame | Workshop + async | Workshop + async | Workshop + async | Workshop + async |
Outputdifferent | North Star metric, Input metric tree, Measurement cadence | Constraint List, Hard/Soft Classification, Option Impact Notes, Decision Boundaries | DACI Matrix, Decision Owner, Decision Log | RAPID Role Map, Recommendation, Decision Log |
Tagsno overlap | GrowthMetricsAlignmentRetention | ConstraintsDecisionPlanningOptions | DecisionRolesGovernanceAlignment | DecisionRolesGovernance |