View methods side by side.
Choose up to four methods. Add them using the search and share the comparison by copying its link.
| Criterion |  Growth North Star Metric |  Operations Change Analysis | 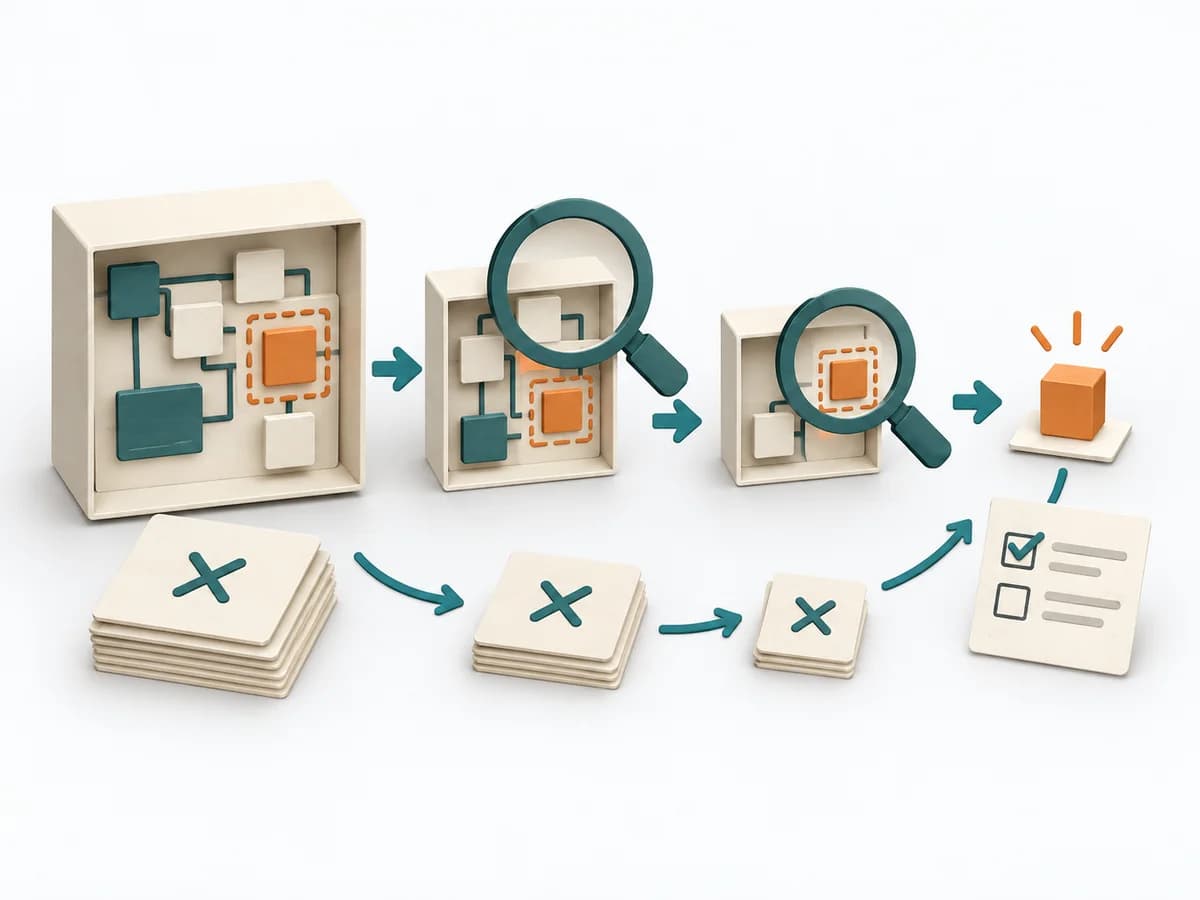 Engineering Fault Isolation |  Growth Flywheel |
|---|---|---|---|---|
Purposedifferent | When product teams track many metrics, the view of the actual customer outcome easily gets lost. A North Star Metric bundles growth, usage, and value contribution into one signal that makes the system's direction visible. | For a deviation after a change, the method isolates the influence of the altered condition. It narrows down which differences are relevant and which are just accompanying noise. | In technical failures, the visible symptom often gets mixed up with the actual cause. Fault Isolation narrows the fault space and progressively reduces which part of the system is truly affected. | Growth often breaks down where a reinforcing mechanism builds up too much friction. A Flywheel shows the cycle of value, repetition, and reinforcement meant to sustain growth. |
Complexitysame | Medium | Medium | Medium | Medium |
Timedifferent | 1-2 h | 45-120 min | 30-180 min | 60-120 min |
Participantsdifferent | 3-8 | 2-6 | 1-6 | 3-8 |
Formatdifferent | Workshop + async | Workshop + async | Workshop + async | Workshop |
Outputdifferent | North Star metric, Input metric tree, Measurement cadence | Change Matrix, Cause Hypotheses, Validation Questions, Action List | Fault Isolation Map, Test Log, Excluded Hypotheses, Narrowed Fault Area | Flywheel Map, Friction Points, Growth Levers, Experiment Backlog |
Tagsno overlap | GrowthMetricsAlignmentRetention | ChangeRoot causeTroubleshootingComparison | TroubleshootingDiagnosisEngineering | GrowthRetentionConversion |