View methods side by side.
Choose up to four methods. Add them using the search and share the comparison by copying its link.
| Criterion |  Agile NoEstimates |  Business Strategy SWOT Analysis | 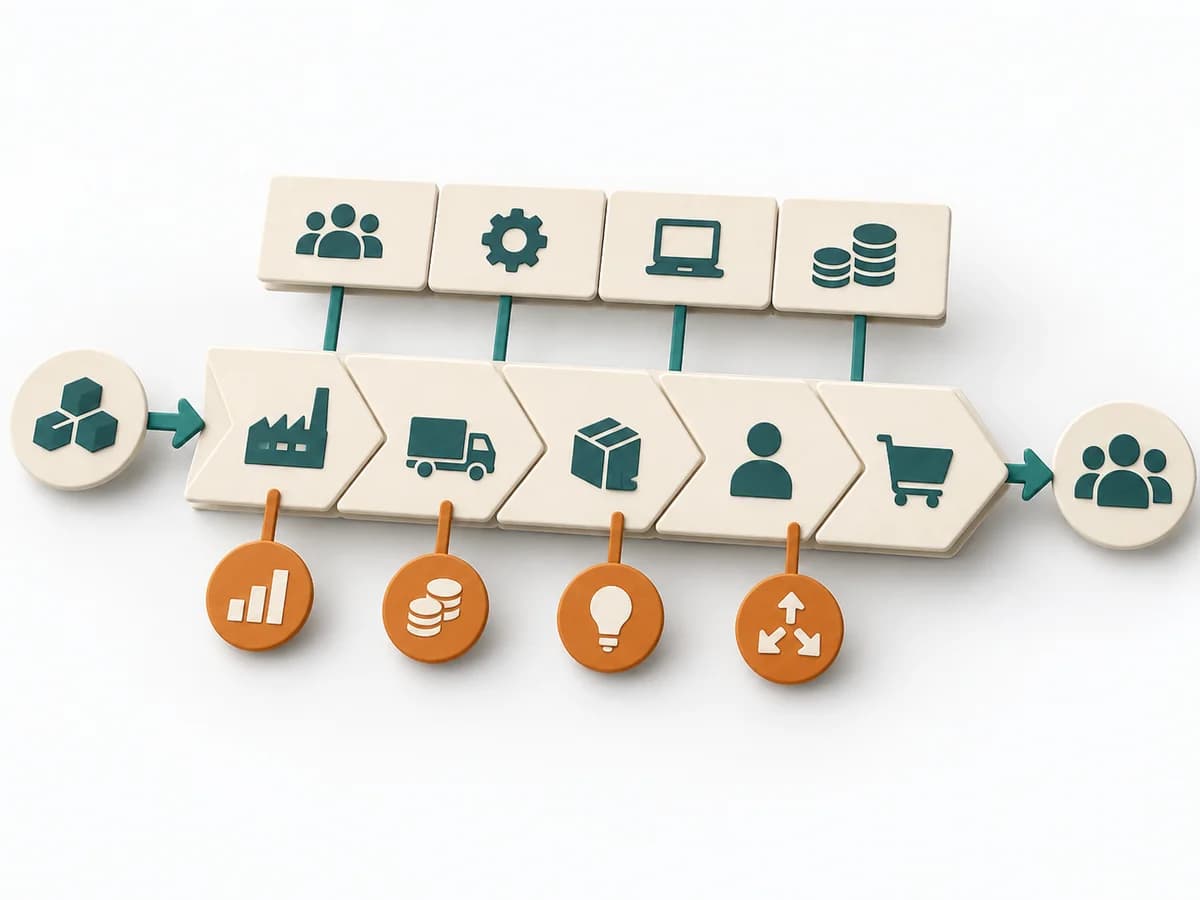 Business Strategy Value Chain Analysis |  Business Strategy Ansoff Matrix |
|---|---|---|---|---|
Purposedifferent | When estimating slows a team down more than it helps, it shifts the focus to flow, small slices, and real lead time. It sorts work by value, risk, and delivery ability. The result is captured as Throughput Data, Flow Forecast, and Slicing Rules. | SWOT Analysis arranges strengths, weaknesses, opportunities, and threats into a compact picture of the situation. It keeps internal capabilities and external influences separate before strategic options emerge from them. | Value Chain Analysis shows where value is created, costs accrue, and differentiation becomes possible along the process. It compares strengths, risks, market logic, and courses of action. The result is captured as a value-chain map and lever list. | The Ansoff Matrix organizes growth options by market and product relation. It helps weigh expansion, diversification, and adaptation cleanly against each other. |
Complexitydifferent | Medium | Low | High | Low |
Timedifferent | laufend | 30-60 min | Half day | 45-90 min |
Participantsdifferent | 2-12 | 3-12 | 3-8 | 2-8 |
Formatdifferent | Workshop + async | Workshop | Workshop | Workshop + async |
Outputdifferent | Throughput Data, Flow Forecast, Slicing Rules | SWOT matrix, Strategic options, Action list | Value Chain Map, Lever List | Ansoff Matrix, Growth Options, Risk Notes |
Tagsno overlap | EstimationForecastingFlow | StrategyAnalysisMarketPositioning | StrategyBusiness modelDiagnosisAnalysis | GrowthStrategyMarketPortfolio |