View methods side by side.
Choose up to four methods. Add them using the search and share the comparison by copying its link.
| Criterion |  Agile NoEstimates |  Operations Root Cause Analysis | 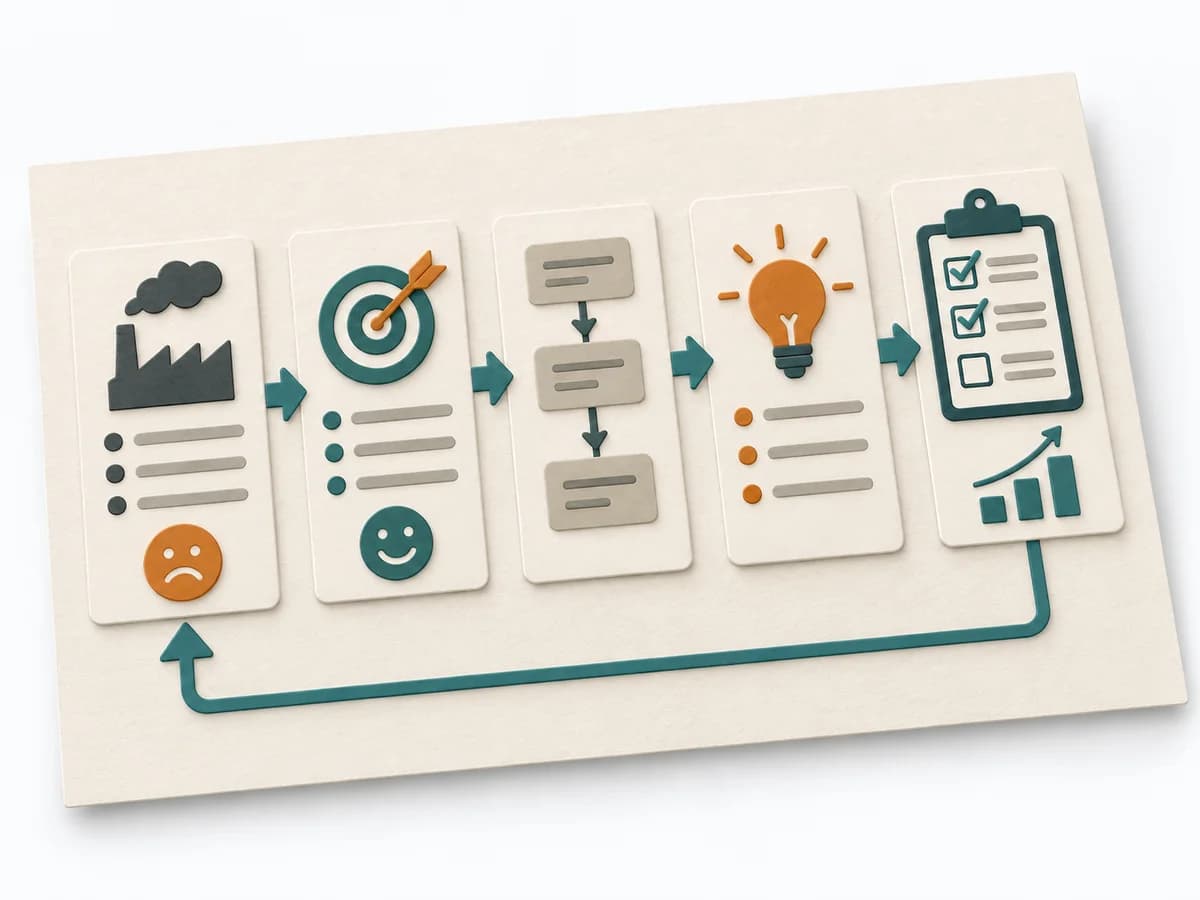 Operations A3 Problem Solving |  Operations Fishbone Diagram |
|---|---|---|---|---|
Purposedifferent | When estimating slows a team down more than it helps, it shifts the focus to flow, small slices, and real lead time. It sorts work by value, risk, and delivery ability. The result is captured as Throughput Data, Flow Forecast, and Slicing Rules. | When a problem keeps recurring and the cause stays unclear, the method exposes the underlying mechanism. It separates symptom, guess, and robust explanation from one another. | For a complex deviation with several people involved, the method bundles problem, analysis, and decision onto one page. It creates a shared working space where causes, countermeasures, and follow-up fit together. | When a problem has several possible contributing factors, the method sorts causes by cause areas. It prevents an initial hunch from blocking the view of other plausible drivers. |
Complexitydifferent | Medium | Medium | Medium | Low |
Timedifferent | laufend | 1-4 h | 45-90 min | 30-60 min |
Participantsdifferent | 2-12 | 3-8 | 2-5 | 2-8 |
Formatdifferent | Workshop + async | Workshop + async | Workshop + async | Workshop |
Outputdifferent | Throughput Data, Flow Forecast, Slicing Rules | Problem Statement, Cause Hypotheses, Confirmed Causes, Action Plan | A3 Report, Action Plan, Root Cause Analysis | Fishbone Diagram, Cause Categories, Investigation Backlog |
Tagsno overlap | EstimationForecastingFlow | Root causeProblem solvingQualityIncident | LeanProblem solvingCoachingOperations | Root causeQualityOperations |