View methods side by side.
Choose up to four methods. Add them using the search and share the comparison by copying its link.
| Criterion |  Agile NoEstimates | 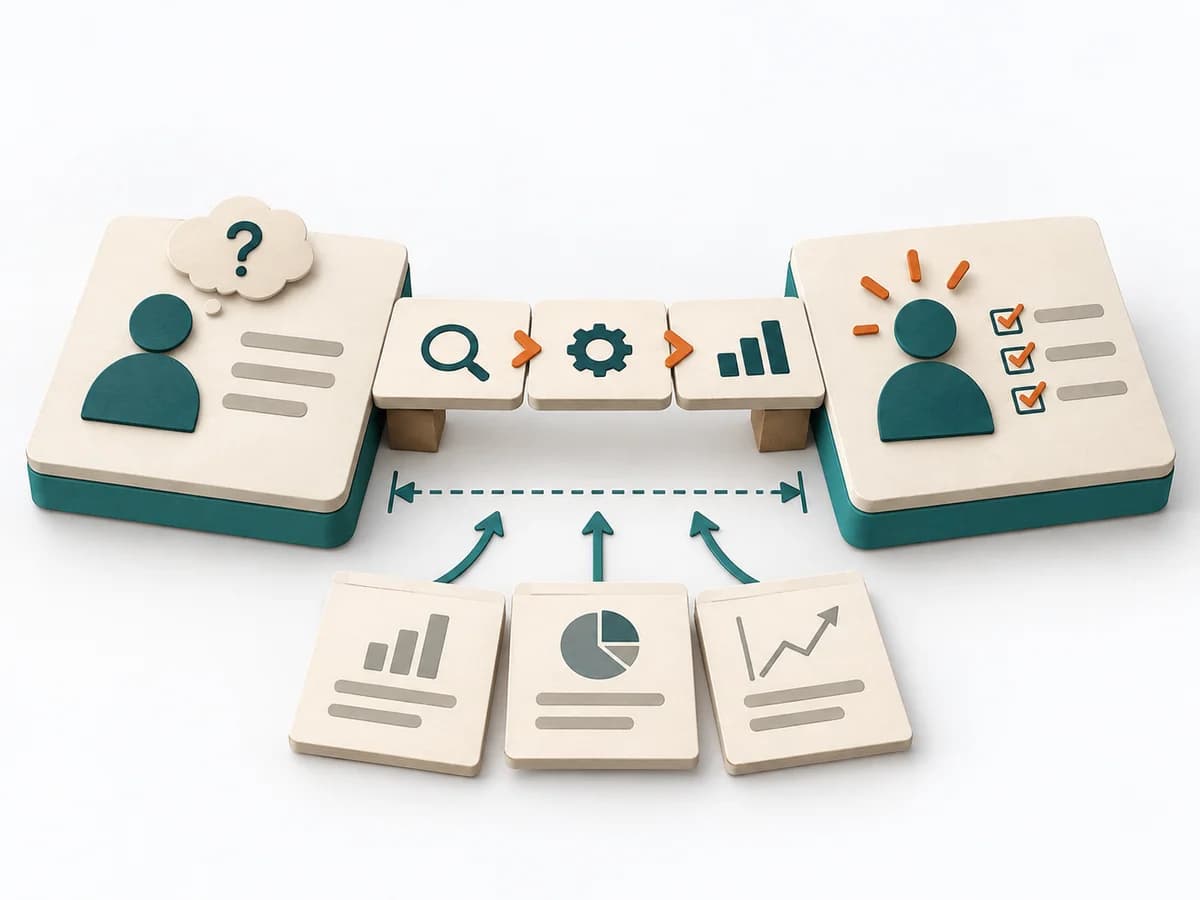 Business Strategy GAP Analysis |  Delivery Monte Carlo Forecasting | 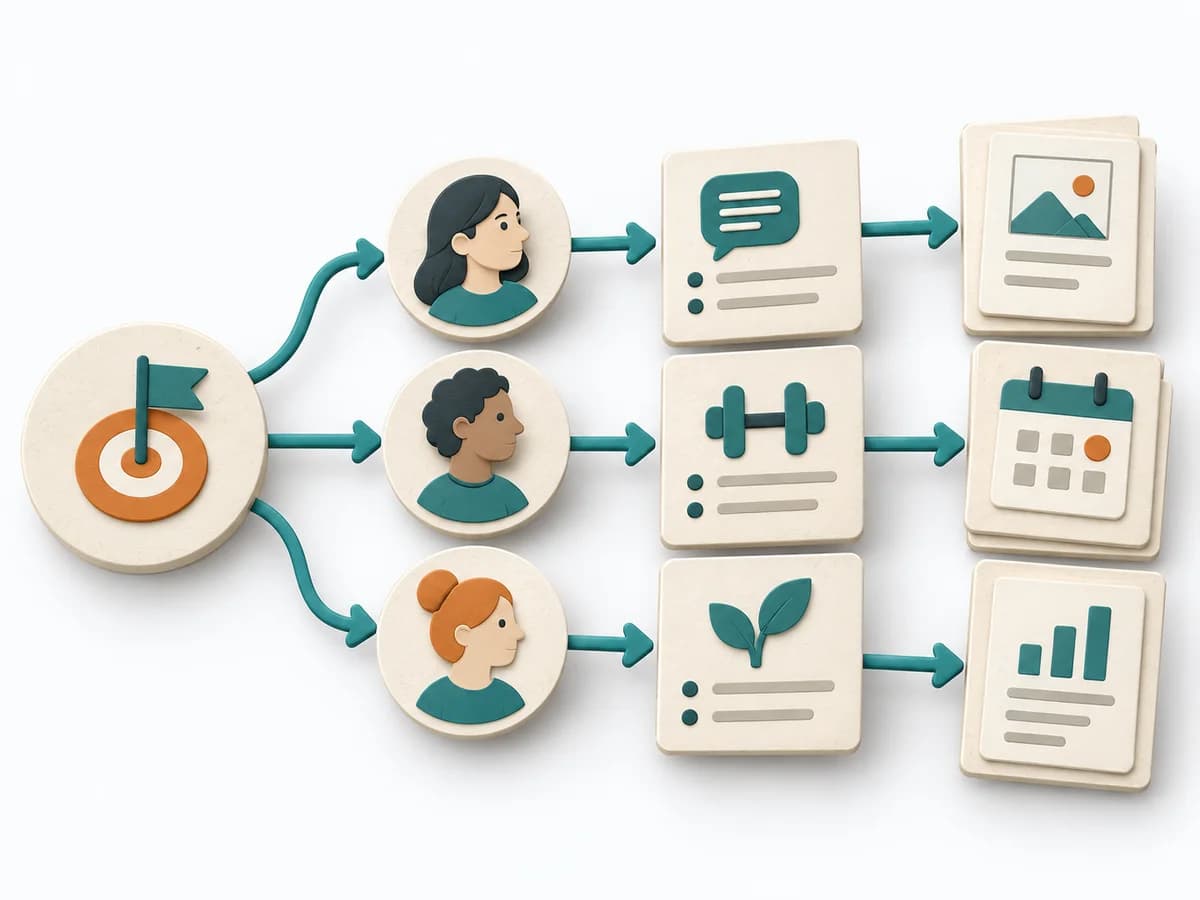 Product Strategy Impact Mapping |
|---|---|---|---|---|
Purposedifferent | When estimating slows a team down more than it helps, it shifts the focus to flow, small slices, and real lead time. It sorts work by value, risk, and delivery ability. The result is captured as Throughput Data, Flow Forecast, and Slicing Rules. | GAP Analysis compares the current state with a target picture and makes the distance manageable. It becomes useful when, ahead of new initiatives, it must become clear which capabilities, processes, or resources are missing. | Helps clarify scope, sequence, and delivery flow in concrete terms. It makes work, boundaries, and order steerable. The result is captured as Forecast Percentiles, Throughput Dataset, and Risk Communication. | When a goal needs to be connected to several possible paths, it shows chains of impact instead of feature lists. It connects business goal, behavior change, and measures. |
Complexitydifferent | Medium | Medium | High | Medium |
Timedifferent | laufend | 1-3 h | 30-90 min Setup, danach laufend | 45-90 min |
Participantsdifferent | 2-12 | 2-8 | 1-8 | 3-8 |
Formatdifferent | Workshop + async | Workshop + async | Workshop + async | Workshop |
Outputdifferent | Throughput Data, Flow Forecast, Slicing Rules | Gap Matrix, Action Plan, Risk Notes | Forecast Percentiles, Throughput Dataset, Risk Communication | Impact Map, Outcome Hypotheses, Delivery Options |
Tagsno overlap | EstimationForecastingFlow | StrategyAnalysisPlanning | ForecastingFlowDelivery | OutcomesStrategyBehaviorPlanning |