View methods side by side.
Choose up to four methods. Add them using the search and share the comparison by copying its link.
| Criterion |  Delivery Monte Carlo Forecasting | 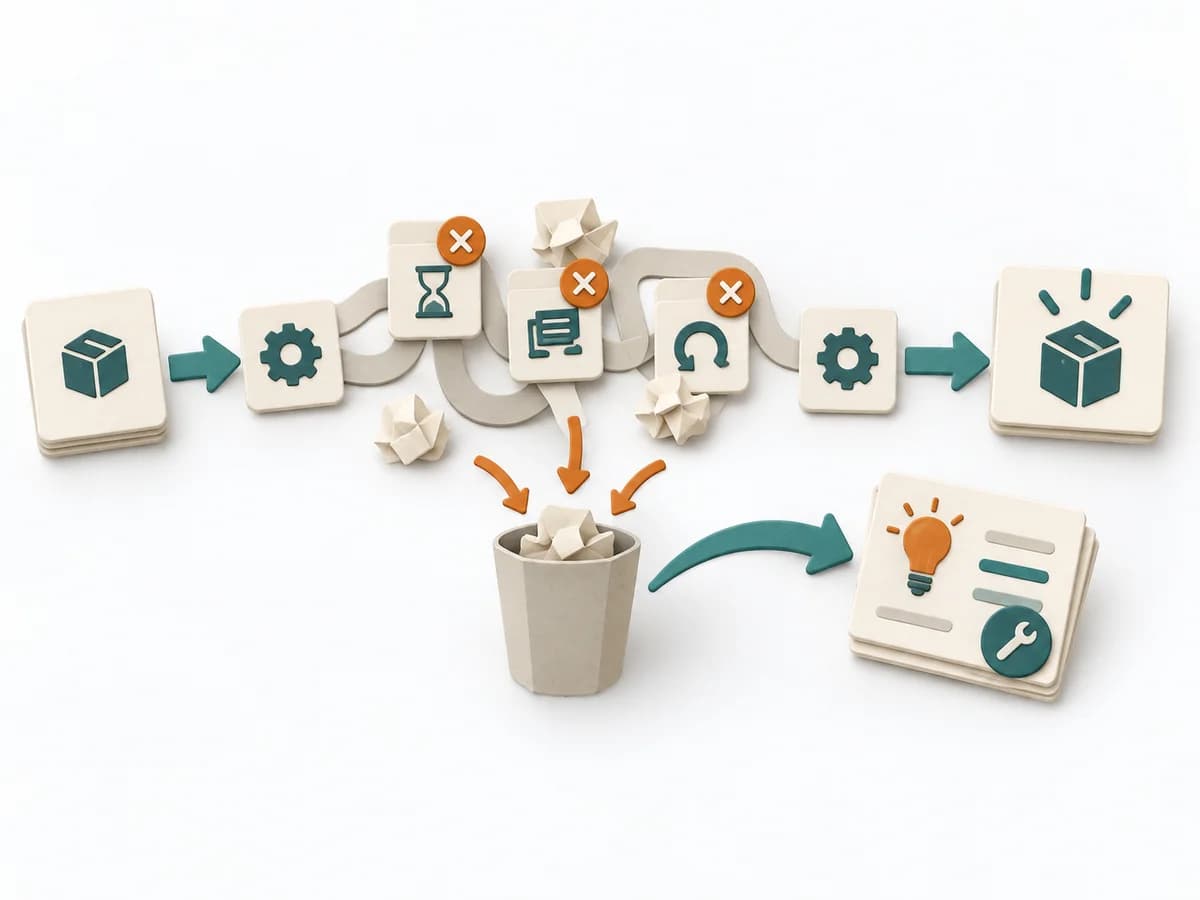 Operations Waste Analysis | 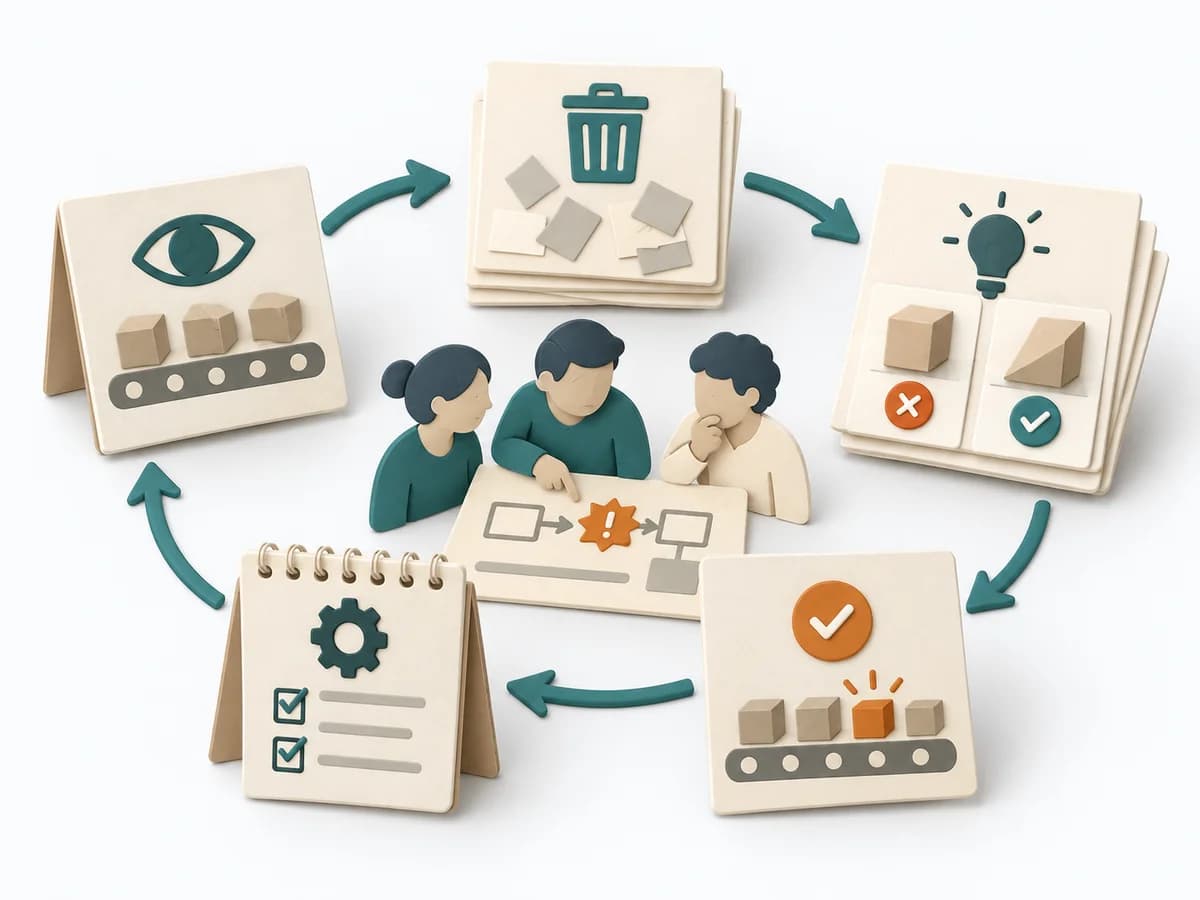 Operations Kaizen Event | 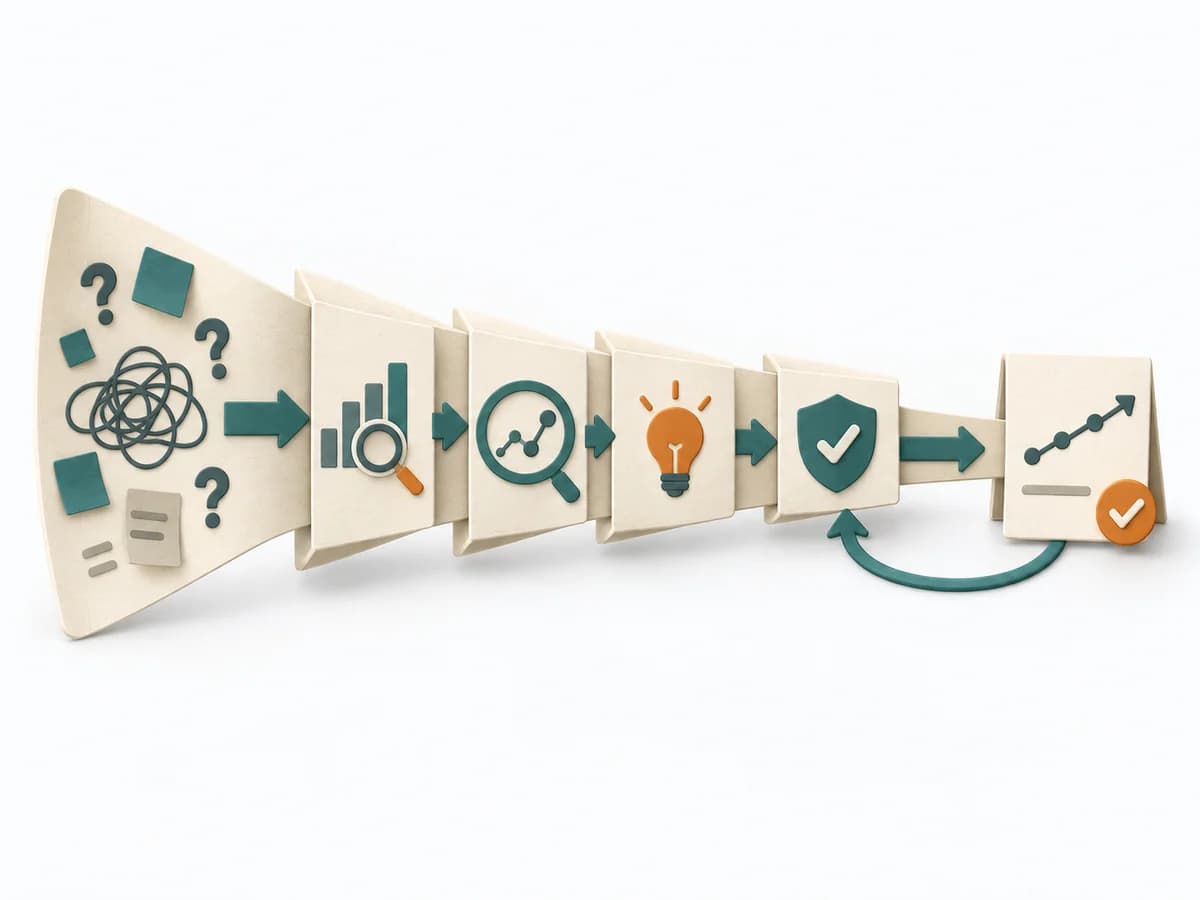 Operations DMAIC |
|---|---|---|---|---|
Purposedifferent | Helps clarify scope, sequence, and delivery flow in concrete terms. It makes work, boundaries, and order steerable. The result is captured as Forecast Percentiles, Throughput Dataset, and Risk Communication. | For a process that keeps people busy but creates little value, the method exposes waste. It directs attention to unnecessary movement, waiting times, rework, and overdelivery. | For a tightly scoped process segment with noticeable waste, the method bundles shared energy for change. It suits situations that call for fast learning loops and visible adjustments. | For a process problem with fluctuating performance, the method brings analysis and improvement into a disciplined sequence. It creates a framework in which numbers, causes, and control come together. |
Complexitydifferent | High | Low | Medium | High |
Timedifferent | 30-90 min Setup, danach laufend | 45-120 min | 0.5-5 Tage | 2-12 Wochen |
Participantsdifferent | 1-8 | 2-8 | 4-10 | 3-10 |
Formatdifferent | Workshop + async | Workshop | Workshop | Workshop + async |
Outputdifferent | Forecast Percentiles, Throughput Dataset, Risk Communication | Waste Map, Prioritized Waste, Improvement Backlog | Kaizen Charter, Waste List, Improvement Experiments, Standard Work Update | Project Charter, Measurement Plan, Cause Analysis, Control Plan |
Tagsno overlap | ForecastingFlowDelivery | WasteLeanProcess improvement | LeanContinuous improvementOperations | Continuous improvementQualityProcess improvement |