View methods side by side.
Choose up to four methods. Add them using the search and share the comparison by copying its link.
| Criterion |  Delivery Monte Carlo Forecasting | 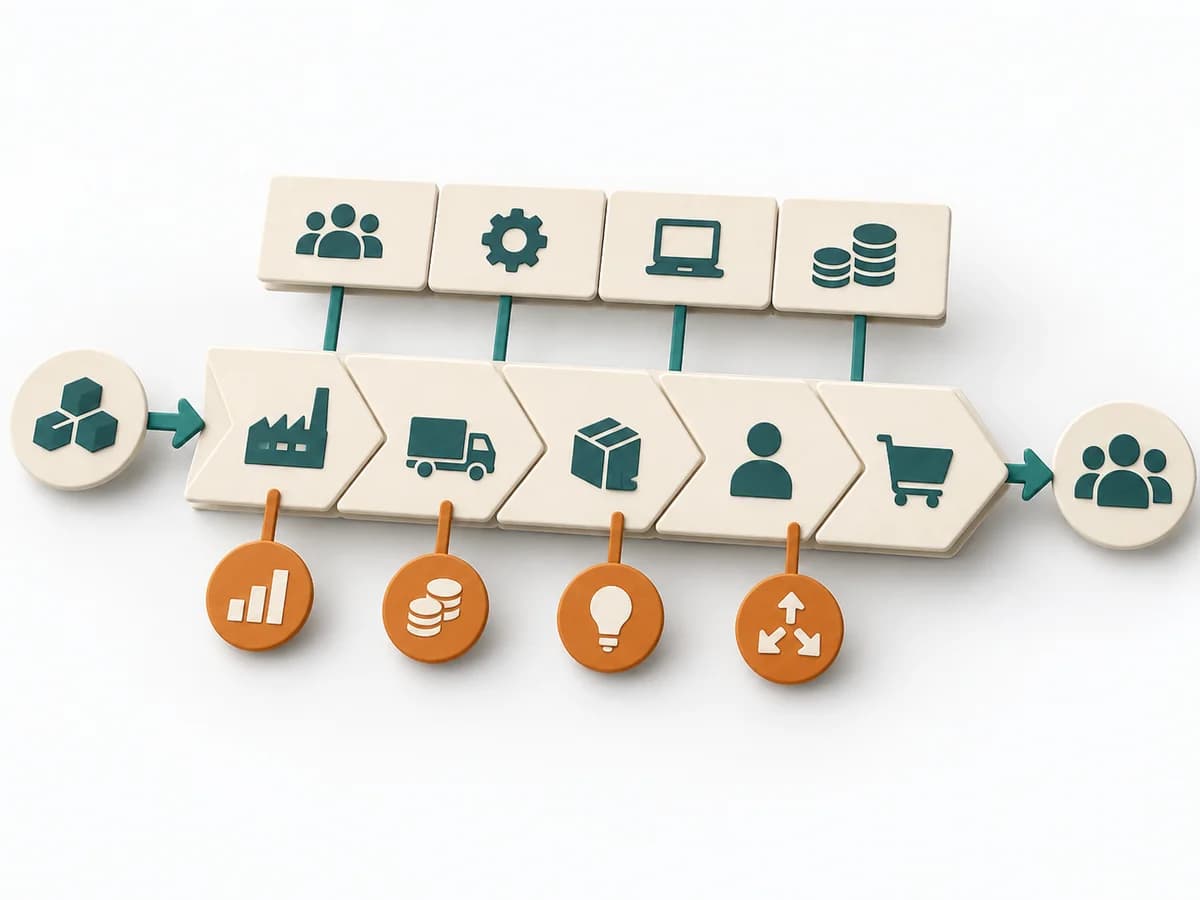 Business Strategy Value Chain Analysis |  Facilitation Stakeholder Mapping | 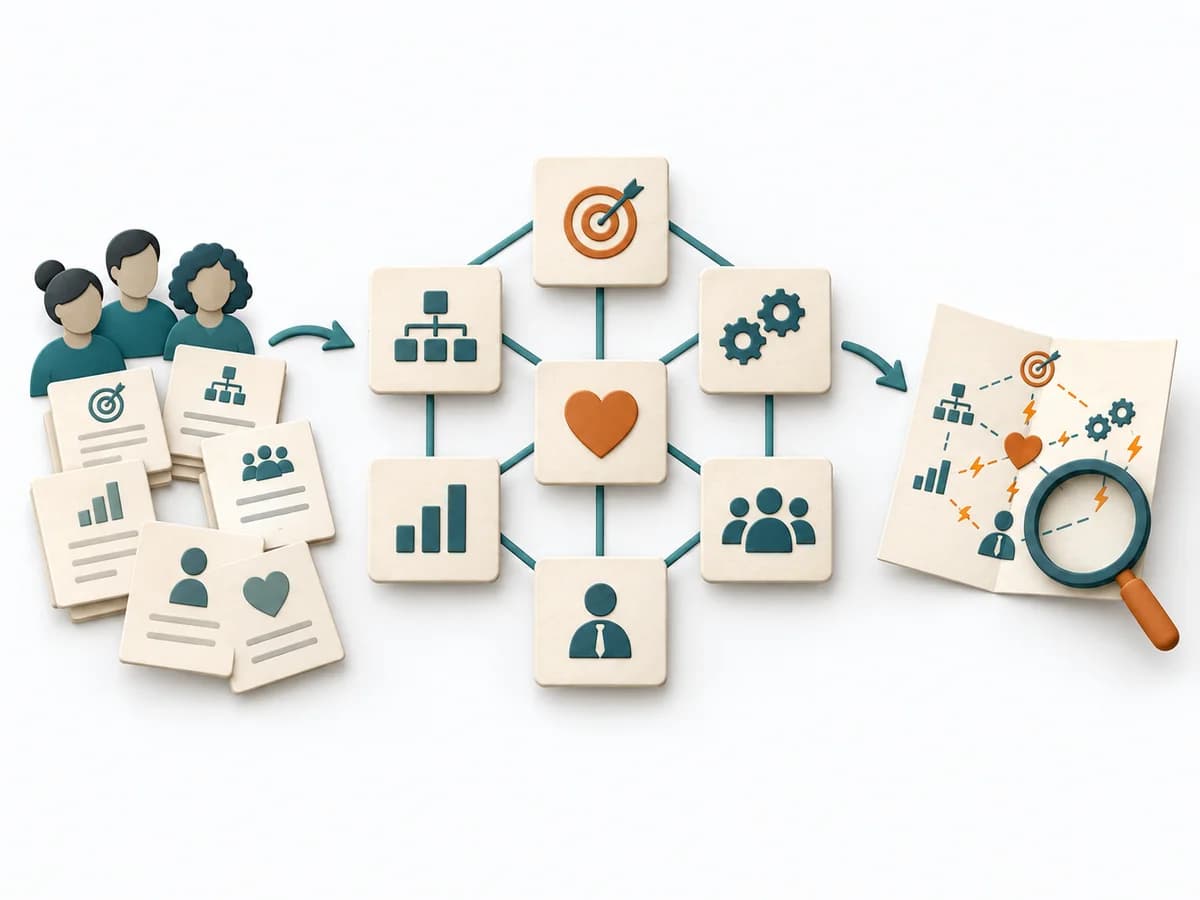 Business Strategy McKinsey 7S |
|---|---|---|---|---|
Purposedifferent | Helps clarify scope, sequence, and delivery flow in concrete terms. It makes work, boundaries, and order steerable. The result is captured as Forecast Percentiles, Throughput Dataset, and Risk Communication. | Value Chain Analysis shows where value is created, costs accrue, and differentiation becomes possible along the process. It compares strengths, risks, market logic, and courses of action. The result is captured as a value-chain map and lever list. | When an initiative depends on many people, interests, and power dynamics, Stakeholder Mapping systematically orders the environment. It shows who influences, who is affected, and where relationship management or safeguarding matters first. | McKinsey 7S checks whether Strategy, Structure, Systems, Shared Values, Skills, Style, and Staff fit together. Organizational misalignments become visible across multiple levers as a result. |
Complexitydifferent | High | High | Low | Medium |
Timedifferent | 30-90 min Setup, danach laufend | Half day | 60–90 min | 2-4 h |
Participantsdifferent | 1-8 | 3-8 | 2-8 | 3-12 |
Formatdifferent | Workshop + async | Workshop | Workshop + async | Workshop |
Outputdifferent | Forecast Percentiles, Throughput Dataset, Risk Communication | Value Chain Map, Lever List | Stakeholder Map, Engagement Plan, Risk Notes | 7S Assessment, Alignment Gaps, Change Actions |
Tagsno overlap | ForecastingFlowDelivery | StrategyBusiness modelDiagnosisAnalysis | StakeholdersAlignmentFacilitationChange | OrganizationStrategyAlignmentChange |