View methods side by side.
Choose up to four methods. Add them using the search and share the comparison by copying its link.
| Criterion |  Delivery Monte Carlo Forecasting | 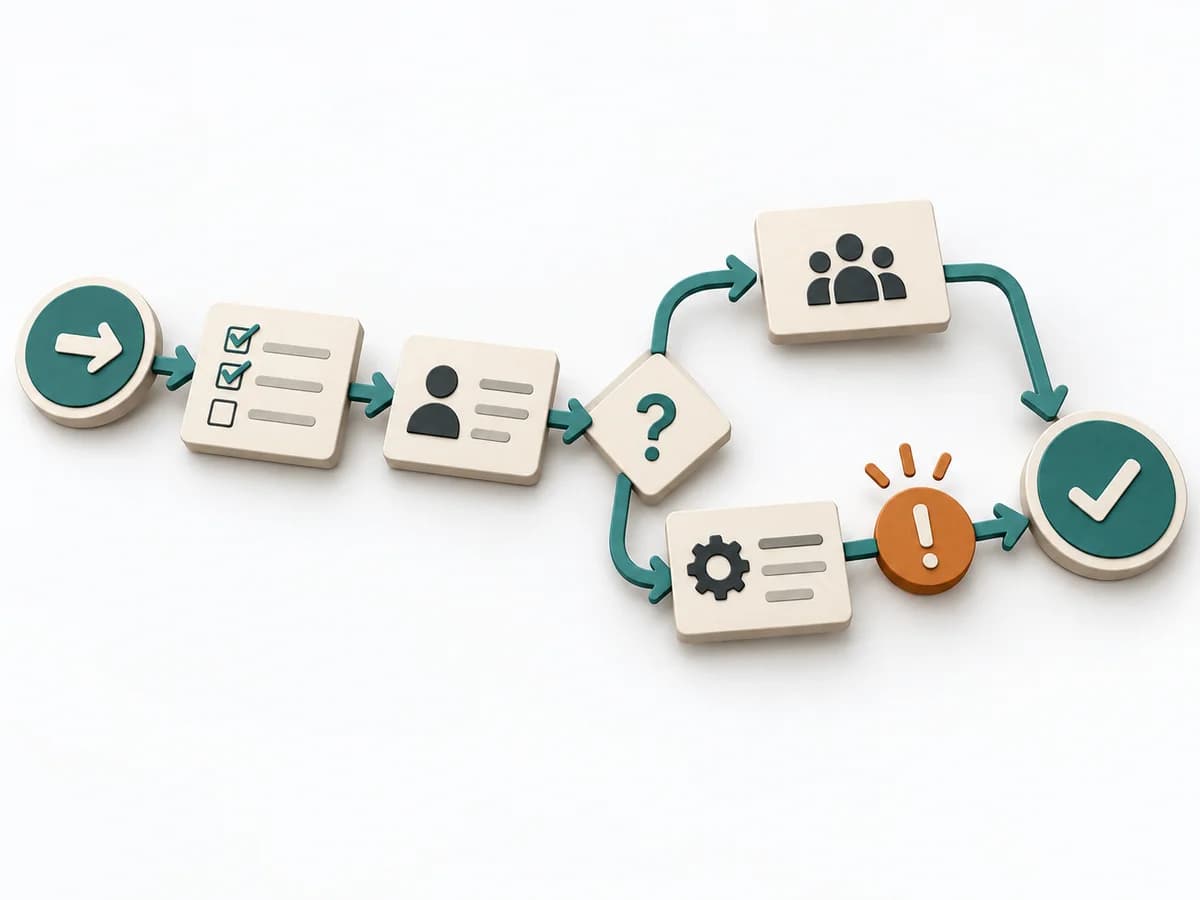 Operations Process Mapping | 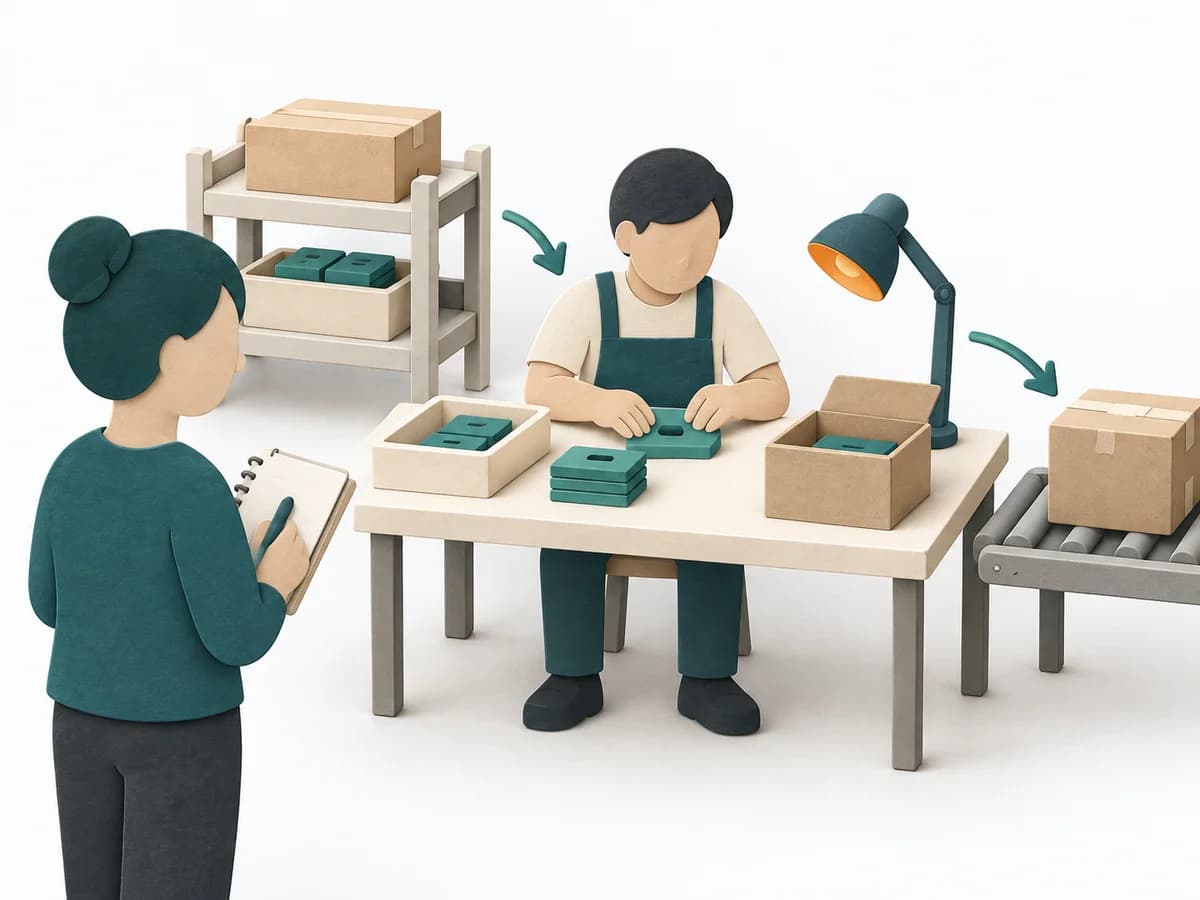 Operations Gemba Walk | 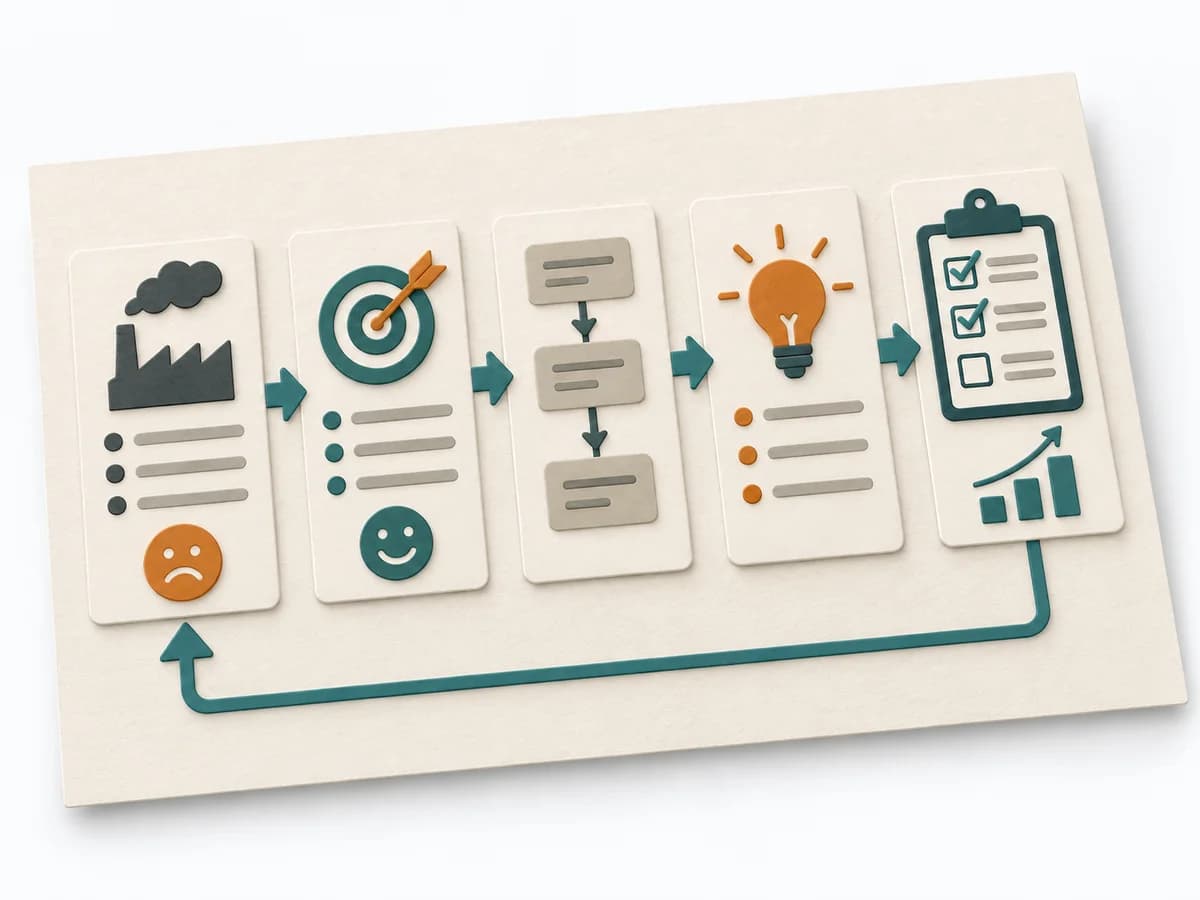 Operations A3 Problem Solving |
|---|---|---|---|---|
Purposedifferent | Helps clarify scope, sequence, and delivery flow in concrete terms. It makes work, boundaries, and order steerable. The result is captured as Forecast Percentiles, Throughput Dataset, and Risk Communication. | With a confusing workflow that has many handoffs, the method makes the actual process visible. It shows where work is passed on, delayed, or duplicated, so improvement targets the right spots. | When there is uncertainty about the real course of a process, the method brings observation to the place where work happens. It combines perception, follow-up questions, and process knowledge so decisions rest on actual workflows instead of assumptions. | For a complex deviation with several people involved, the method bundles problem, analysis, and decision onto one page. It creates a shared working space where causes, countermeasures, and follow-up fit together. |
Complexitydifferent | High | Medium | Low | Medium |
Timedifferent | 30-90 min Setup, danach laufend | 1-3 h | 30-120 min | 45-90 min |
Participantsdifferent | 1-8 | 3-10 | 2-6 | 2-5 |
Formatdifferent | Workshop + async | Workshop | Workshop | Workshop + async |
Outputdifferent | Forecast Percentiles, Throughput Dataset, Risk Communication | Process Map, Handoff List, Improvement Backlog | Observation Notes, Improvement Ideas | A3 Report, Action Plan, Root Cause Analysis |
Tagsno overlap | ForecastingFlowDelivery | ProcessOperationsImprovement | LeanObservationProcessOperations | LeanProblem solvingCoachingOperations |