View methods side by side.
Choose up to four methods. Add them using the search and share the comparison by copying its link.
| Criterion |  Delivery Monte Carlo Forecasting | 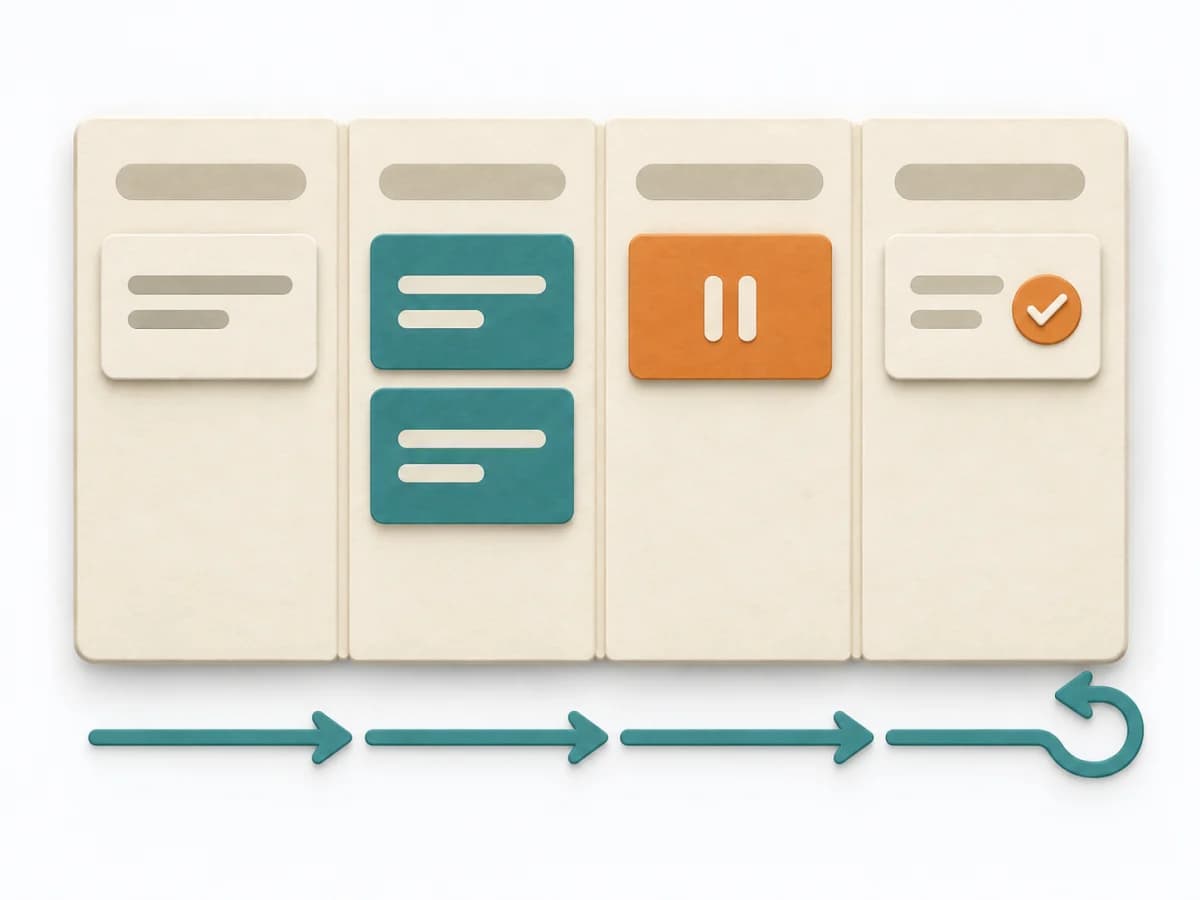 Engineering Kanban |  Operations Root Cause Analysis |  Operations Barrier Analysis |
|---|---|---|---|---|
Purposedifferent | Helps clarify scope, sequence, and delivery flow in concrete terms. It makes work, boundaries, and order steerable. The result is captured as Forecast Percentiles, Throughput Dataset, and Risk Communication. | When work sits in too many parallel streams, throughput suffers and no one sees the bottlenecks. Kanban makes the flow of work visible and limits overload so a system becomes calmer and more predictable. | When a problem keeps recurring and the cause stays unclear, the method exposes the underlying mechanism. It separates symptom, guess, and robust explanation from one another. | For a risk that can only be managed through multiple layers of protection, the method examines the effectiveness of each barrier. It shows where safeguards are missing, too weak, or fail under real conditions. |
Complexitydifferent | High | Medium | Medium | Medium |
Timedifferent | 30-90 min Setup, danach laufend | Ongoing | 1-4 h | 2-4 h |
Participantsdifferent | 1-8 | 2-12 | 3-8 | 2-6 |
Formatsame | Workshop + async | Workshop + async | Workshop + async | Workshop + async |
Outputdifferent | Forecast Percentiles, Throughput Dataset, Risk Communication | Kanban board, WIP policies, Flow metrics | Problem Statement, Cause Hypotheses, Confirmed Causes, Action Plan | Barrier Inventory, Failure Analysis per Barrier, Action Backlog |
Tagsno overlap | ForecastingFlowDelivery | FlowVisual managementDelivery | Root causeProblem solvingQualityIncident | Root causeSafetyIncident |