View methods side by side.
Choose up to four methods. Add them using the search and share the comparison by copying its link.
| Criterion |  Delivery Monte Carlo Forecasting | 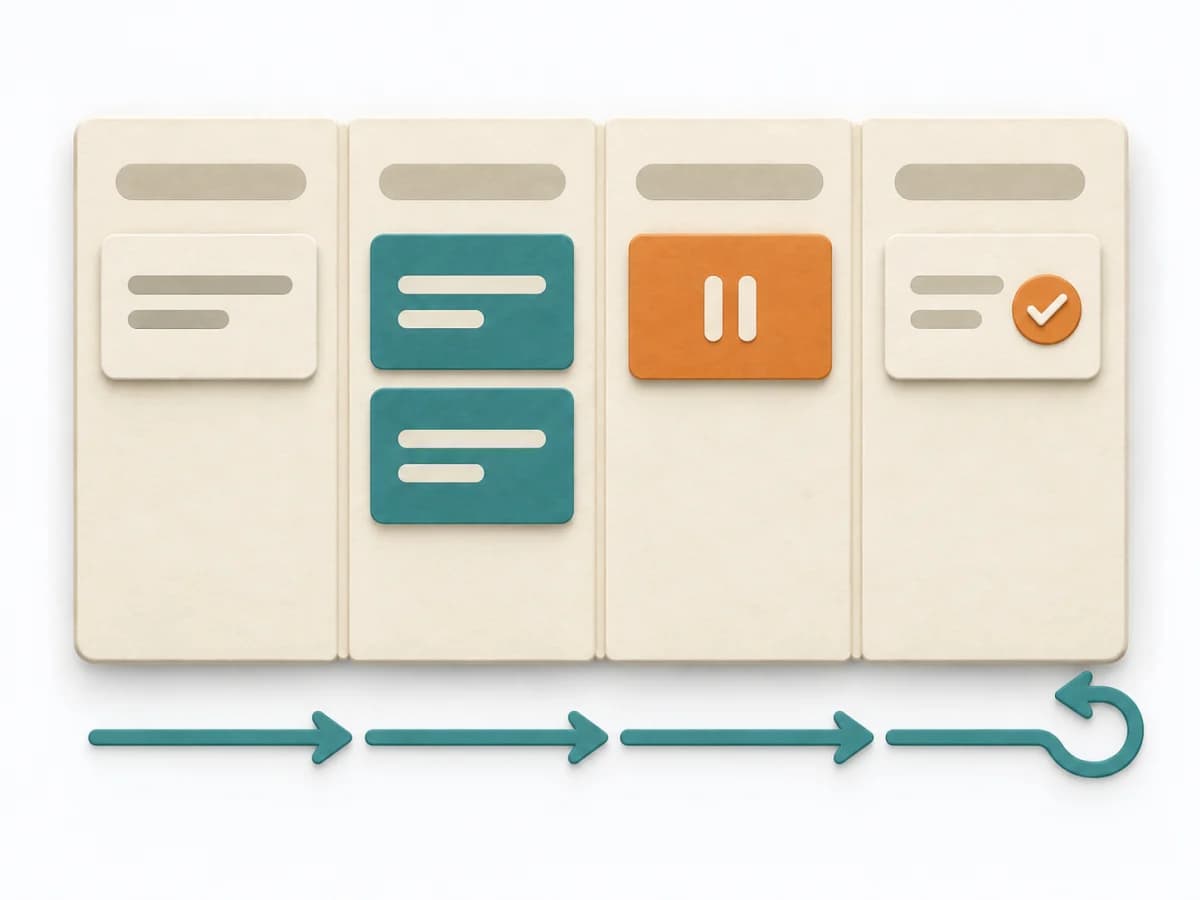 Engineering Kanban | 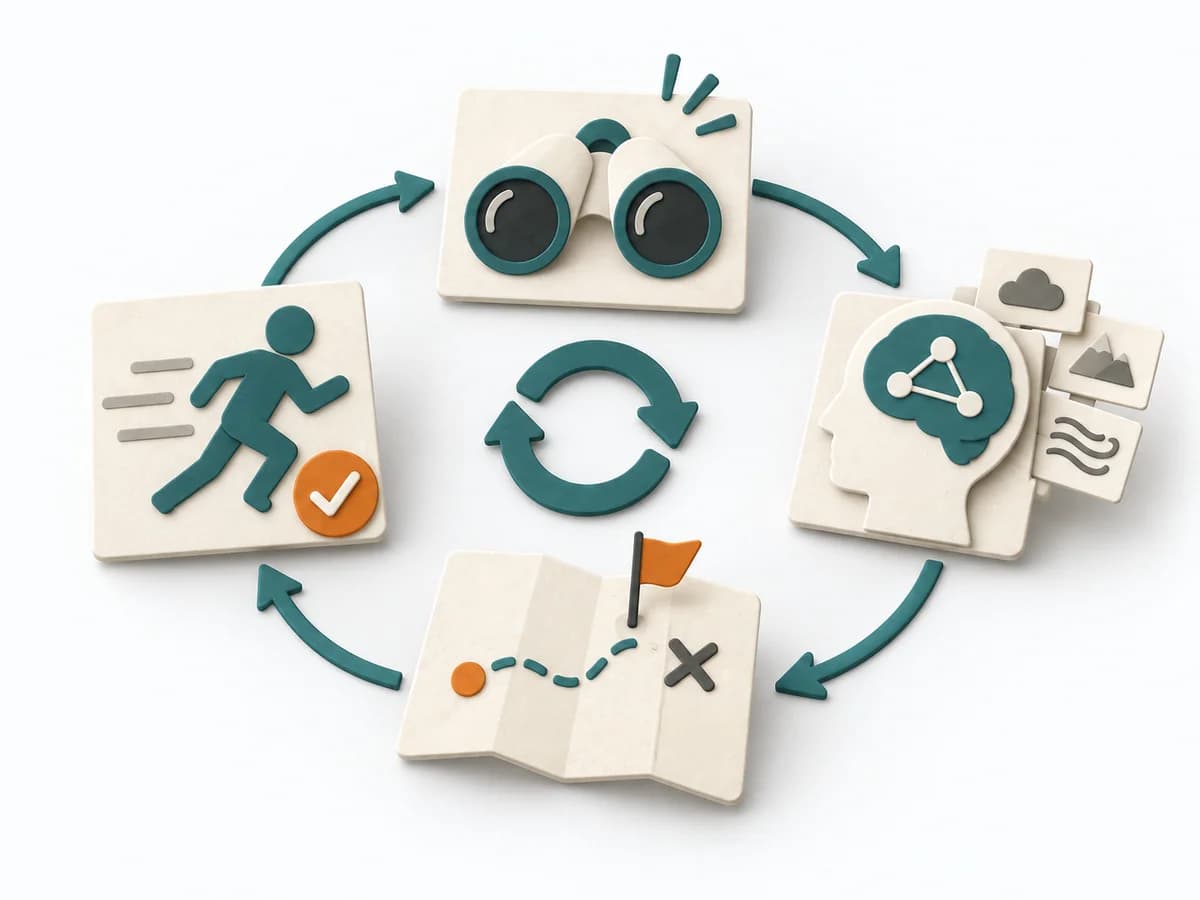 Decision Making OODA Loop | 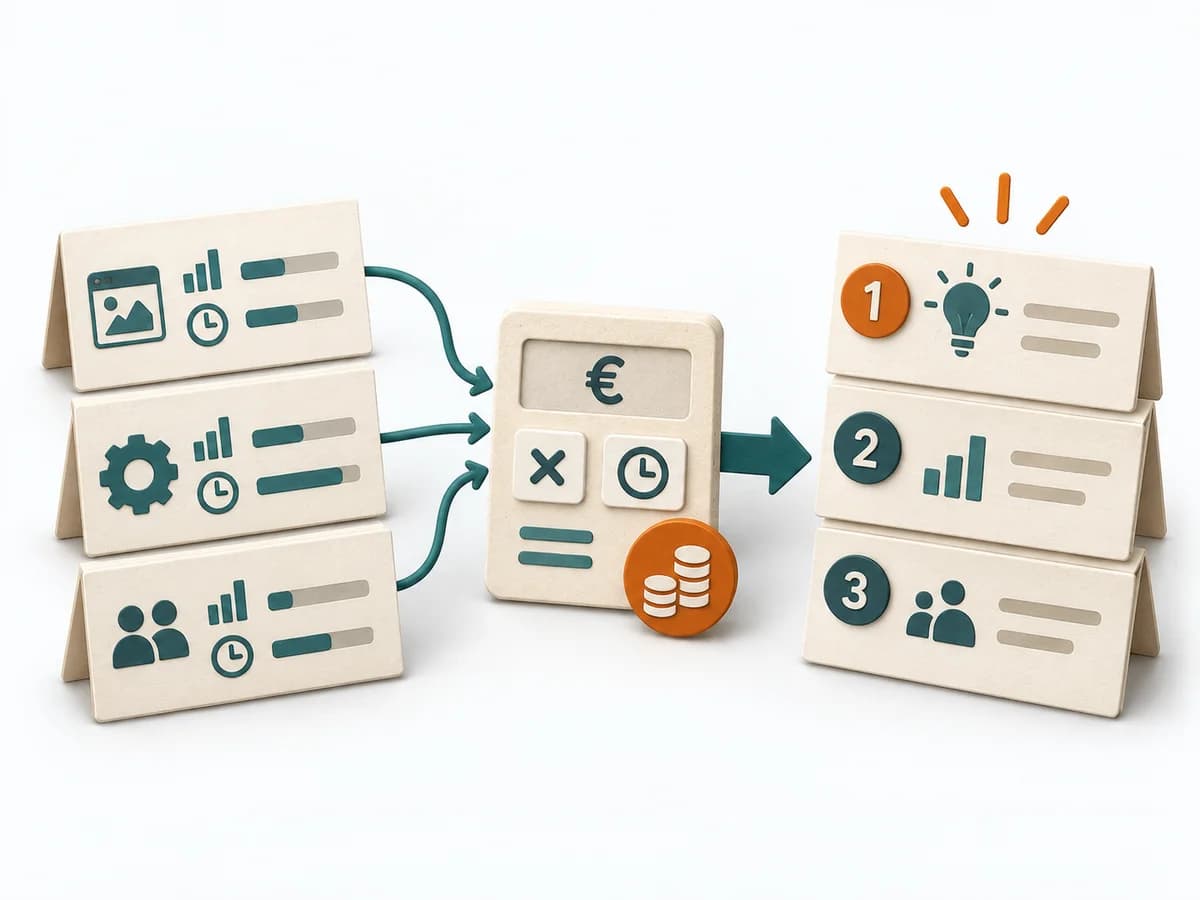 Delivery Cost of Delay |
|---|---|---|---|---|
Purposedifferent | Helps clarify scope, sequence, and delivery flow in concrete terms. It makes work, boundaries, and order steerable. The result is captured as Forecast Percentiles, Throughput Dataset, and Risk Communication. | When work sits in too many parallel streams, throughput suffers and no one sees the bottlenecks. Kanban makes the flow of work visible and limits overload so a system becomes calmer and more predictable. | In dynamic situations, decisions become outdated faster than they can be prepared. The OODA Loop holds observing, orienting, deciding, and acting together as a recurring rhythm so reaction does not slide into inertia. | Helps clarify scope, order, and delivery flow in concrete terms. It makes work, constraints, and sequence manageable. The result is captured as a Cost of Delay table and prioritization sequence. |
Complexitydifferent | High | Medium | Medium | High |
Timedifferent | 30-90 min Setup, danach laufend | Ongoing | 15-60 min je Zyklus | 90-180 min |
Participantsdifferent | 1-8 | 2-12 | 1-8 | 3-8 |
Formatdifferent | Workshop + async | Workshop + async | Workshop + async | Workshop |
Outputdifferent | Forecast Percentiles, Throughput Dataset, Risk Communication | Kanban board, WIP policies, Flow metrics | Situation Assessment, Decision Loop, Action Updates | CoD Table, Prioritization Sequence |
Tagsno overlap | ForecastingFlowDelivery | FlowVisual managementDelivery | DecisionChangeLearningStrategy | PrioritizationDeliveryEconomicsDecision |