View methods side by side.
Choose up to four methods. Add them using the search and share the comparison by copying its link.
| Criterion |  Delivery Monte Carlo Forecasting | 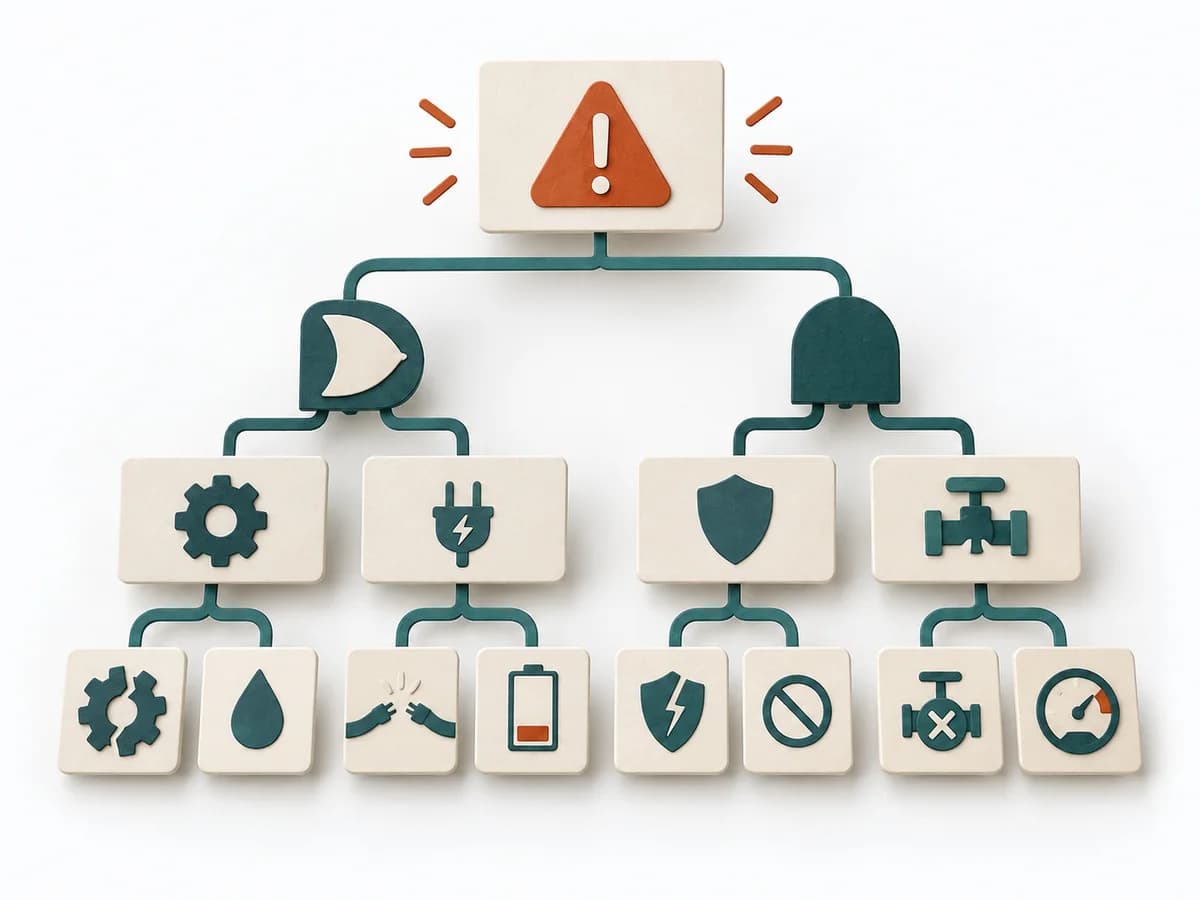 Operations Fault Tree Analysis |  Delivery Value Stream Mapping |  Operations 5 Whys |
|---|---|---|---|---|
Purposedifferent | Helps clarify scope, sequence, and delivery flow in concrete terms. It makes work, boundaries, and order steerable. The result is captured as Forecast Percentiles, Throughput Dataset, and Risk Communication. | For a critical top event with several possible triggers, the method logically models failure paths. It makes visible which combinations of conditions can lead to damage. | When delivery work dissolves into wait times, handoffs, and hidden effort, Value Stream Mapping makes the actual flow visible. The method exposes bottlenecks, idle time, and feedback loops so lead time and improvement levers become tangible. | For a single, hard-to-explain deviation, the method exposes the causal chain behind the visible symptom. It keeps the cause open until a controllable condition emerges instead of a mere description. |
Complexitydifferent | High | High | Medium | Low |
Timedifferent | 30-90 min Setup, danach laufend | 2-6 h | 1-3 h | 15-30 min |
Participantsdifferent | 1-8 | 3-8 | 4-10 | 2-6 |
Formatdifferent | Workshop + async | Workshop + async | Workshop | Workshop |
Outputdifferent | Forecast Percentiles, Throughput Dataset, Risk Communication | Fault Tree, Critical Paths, Cause Hypotheses, Control Actions | Current-state map, Future-state map, Bottleneck list | Root cause notes, Countermeasures |
Tagsno overlap | ForecastingFlowDelivery | RiskRoot causeSafety | LeanFlowWasteDelivery | Root causeIncidentLeanProblem solving |