View methods side by side.
Choose up to four methods. Add them using the search and share the comparison by copying its link.
| Criterion |  Delivery Monte Carlo Forecasting | 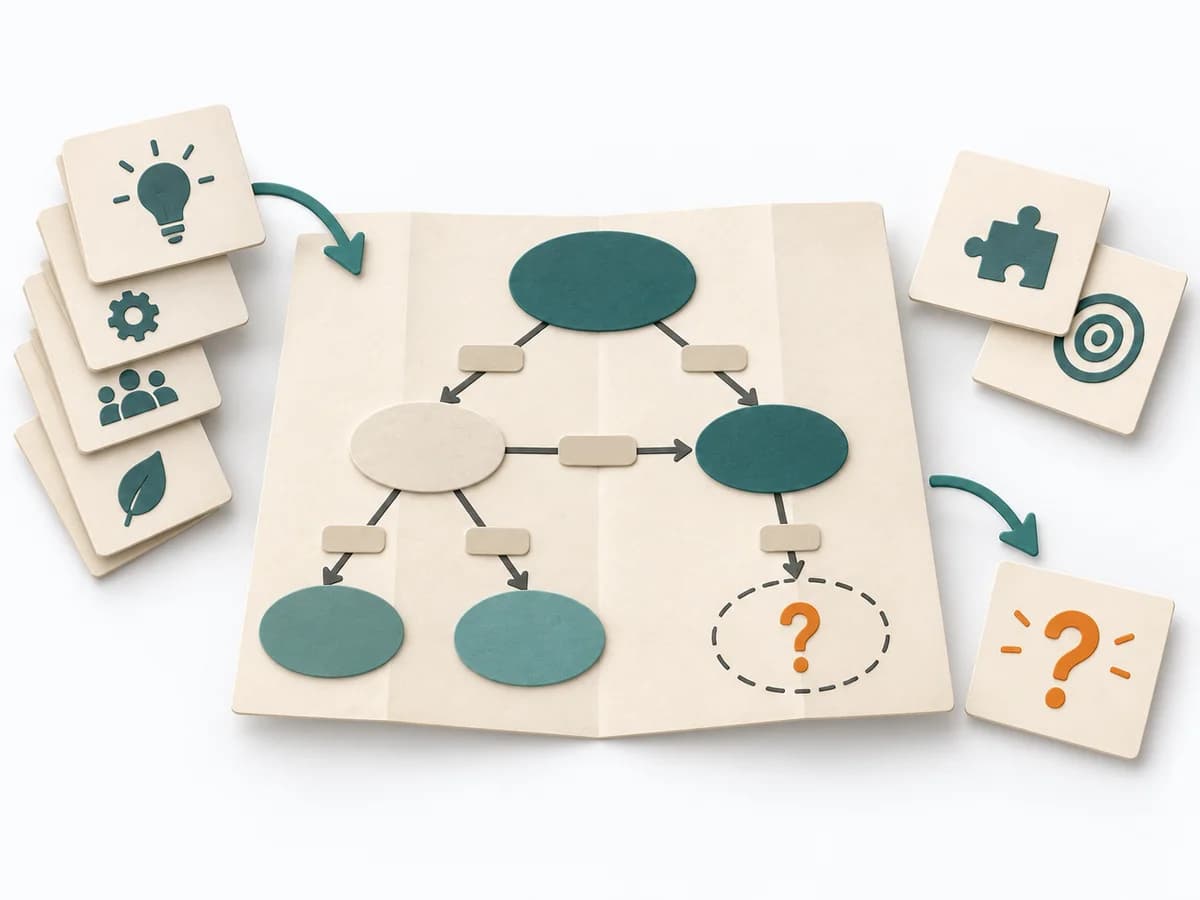 Knowledge Modeling Concept Mapping | 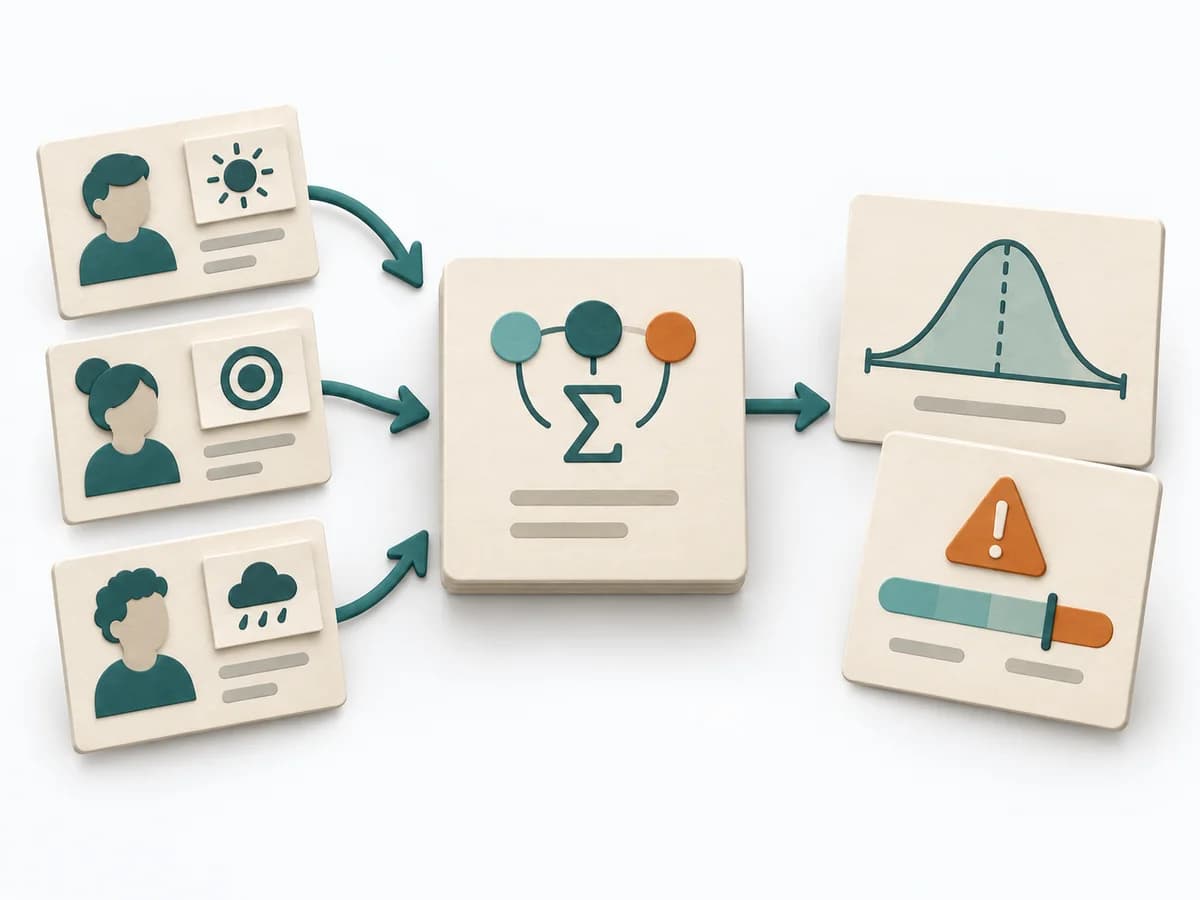 Decision Making PERT Estimation |  Agile NoEstimates |
|---|---|---|---|---|
Purposedifferent | Helps clarify scope, sequence, and delivery flow in concrete terms. It makes work, boundaries, and order steerable. The result is captured as Forecast Percentiles, Throughput Dataset, and Risk Communication. | Concept Mapping arranges terms and relationships in a network that makes subject-matter connections tangible. It fits when a topic needs to be understood structurally rather than linearly. | On complex initiatives, a plain average tends to understate just how uncertain the outcome really is. It separates options, evaluation criteria, and open risks. The result is captured as a PERT Estimate, Expected Value, and Risk Notes. | When estimating slows a team down more than it helps, it shifts the focus to flow, small slices, and real lead time. It sorts work by value, risk, and delivery ability. The result is captured as Throughput Data, Flow Forecast, and Slicing Rules. |
Complexitydifferent | High | Medium | Medium | Medium |
Timedifferent | 30-90 min Setup, danach laufend | 1-2 h | 15-45 min | laufend |
Participantsdifferent | 1-8 | 1-8 | 1-8 | 2-12 |
Formatsame | Workshop + async | Workshop + async | Workshop + async | Workshop + async |
Outputdifferent | Forecast Percentiles, Throughput Dataset, Risk Communication | Concept Map, Relationship Labels, Knowledge Gaps | PERT Estimate, Expected Value, Risk Notes | Throughput Data, Flow Forecast, Slicing Rules |
Tagsno overlap | ForecastingFlowDelivery | KnowledgeConceptsMappingSensemaking | EstimationUncertaintyRisk | EstimationForecastingFlow |