View methods side by side.
Choose up to four methods. Add them using the search and share the comparison by copying its link.
| Criterion |  Delivery Monte Carlo Forecasting | 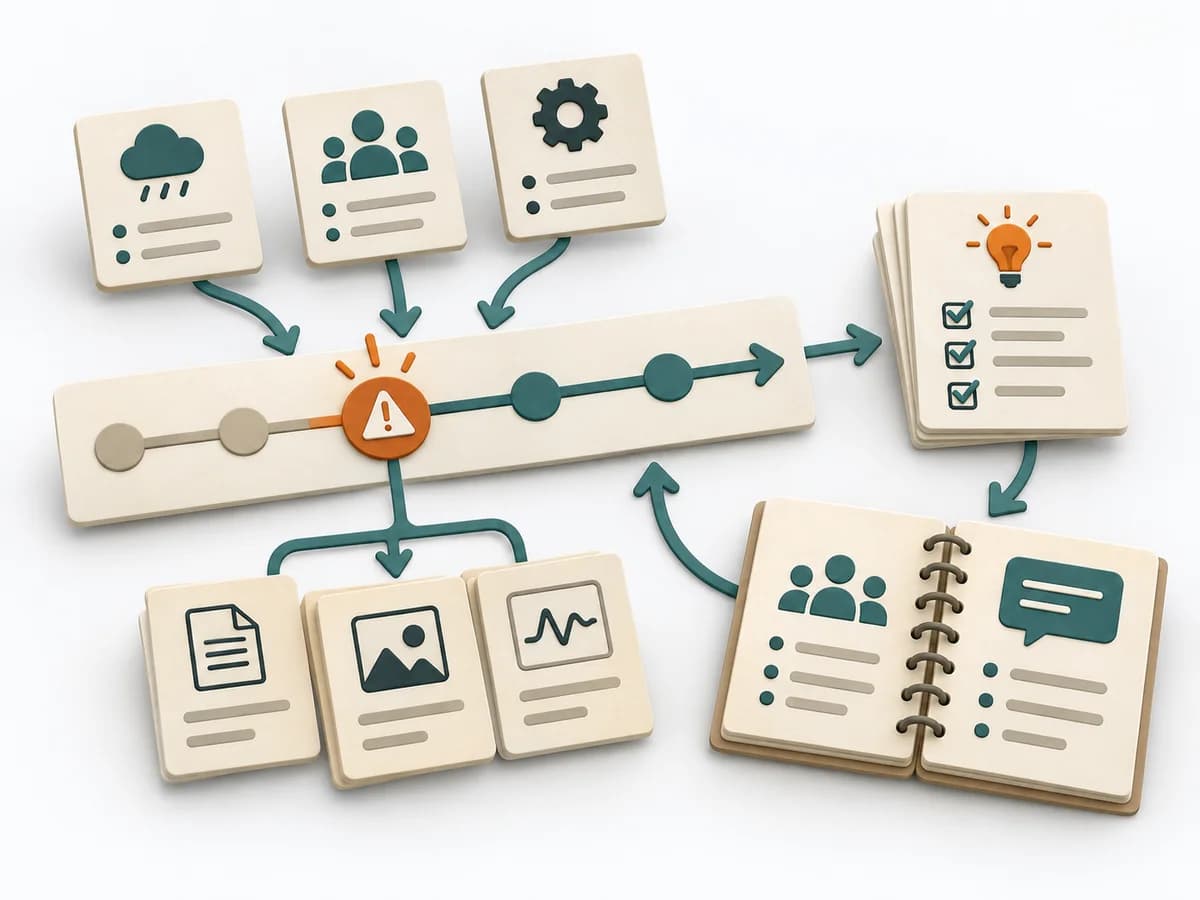 DevOps Blameless Postmortem |  Agile NoEstimates |  DevOps Incident Timeline Analysis |
|---|---|---|---|---|
Purposedifferent | Helps clarify scope, sequence, and delivery flow in concrete terms. It makes work, boundaries, and order steerable. The result is captured as Forecast Percentiles, Throughput Dataset, and Risk Communication. | After an incident with damage or a near miss, the method creates a sober field for learning without assigning blame. It directs attention to the course of events, conditions, and effective countermeasures. | When estimating slows a team down more than it helps, it shifts the focus to flow, small slices, and real lead time. It sorts work by value, risk, and delivery ability. The result is captured as Throughput Data, Flow Forecast, and Slicing Rules. | For an incident with an unclear sequence, the method makes the timeline precisely visible. It separates perception, reaction, and delay so cause and effect become more clearly readable. |
Complexitydifferent | High | Medium | Medium | Medium |
Timedifferent | 30-90 min Setup, danach laufend | 30-90 min | laufend | 60-180 min |
Participantsdifferent | 1-8 | 3-12 | 2-12 | 3-10 |
Formatsame | Workshop + async | Workshop + async | Workshop + async | Workshop + async |
Outputdifferent | Forecast Percentiles, Throughput Dataset, Risk Communication | Postmortem Doc, Action Items, Timeline | Throughput Data, Flow Forecast, Slicing Rules | Incident Timeline, Evidence Log, Delay Analysis, Improvement Actions |
Tagsno overlap | ForecastingFlowDelivery | Site Reliability EngineeringIncidentLearningReliability | EstimationForecastingFlow | IncidentTimelineSite Reliability Engineering |