View methods side by side.
Choose up to four methods. Add them using the search and share the comparison by copying its link.
| Criterion | 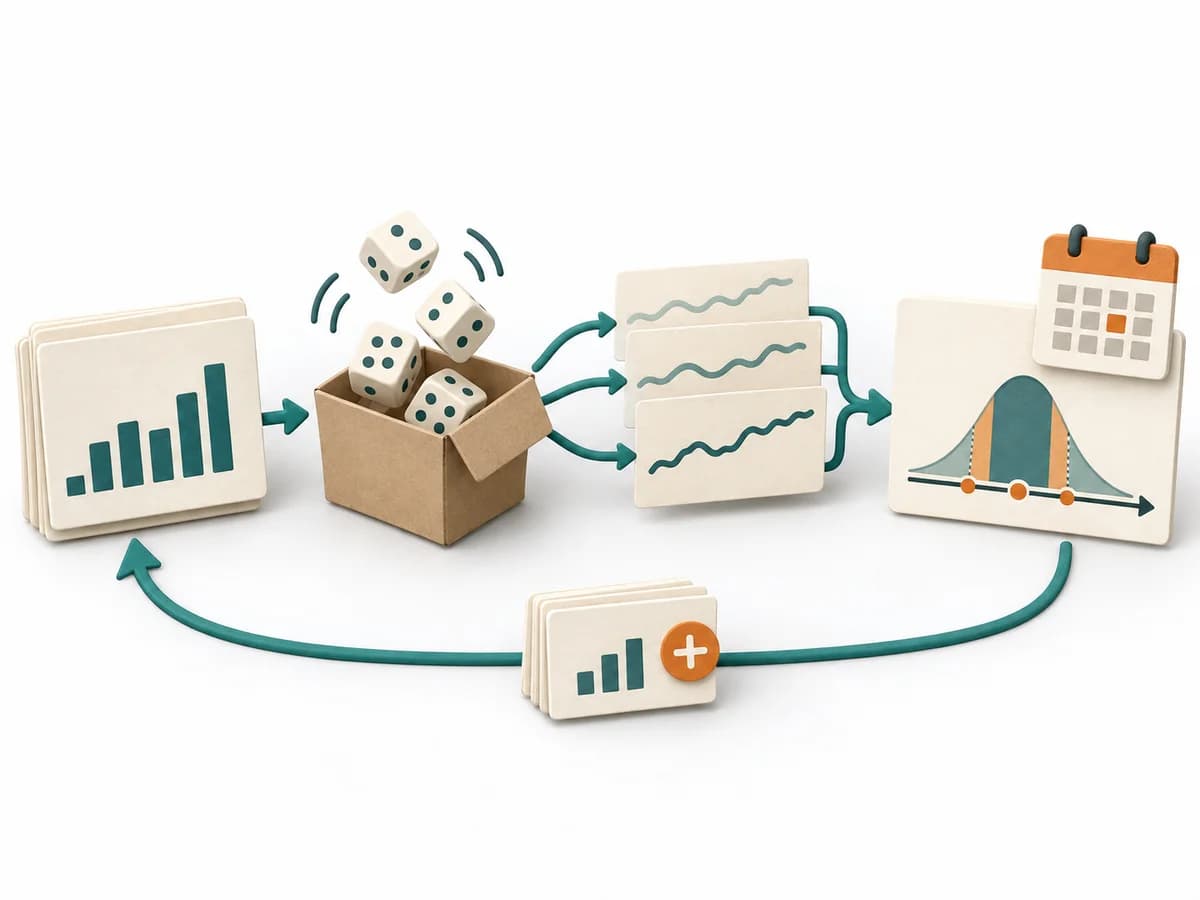 Delivery Monte Carlo Forecasting |  Systems Thinking Behavior Over Time Graph |  Agile NoEstimates |  Systems Thinking Iceberg Model |
|---|---|---|---|---|
Purposedifferent | Helps clarify scope, sequence, and delivery flow in concrete terms. It makes work, boundaries, and order steerable. The result is captured as Forecast Percentiles, Throughput Dataset, and Risk Communication. | A Behavior Over Time Graph shows how a metric or observation develops over time. The method makes trends, breaks, and recurring patterns visible that get lost in snapshots. | When estimating slows a team down more than it helps, it shifts the focus to flow, small slices, and real lead time. It sorts work by value, risk, and delivery ability. The result is captured as Throughput Data, Flow Forecast, and Slicing Rules. | The Iceberg Model separates visible events from patterns, structures, and mental models. This turns a single observation into a deeper understanding of why a problem keeps recurring. |
Complexitydifferent | High | Low | Medium | Low |
Timedifferent | 30-90 min Setup, danach laufend | 20-45 min | laufend | 30-60 min |
Participantsdifferent | 1-8 | 1-10 | 2-12 | 2-10 |
Formatsame | Workshop + async | Workshop + async | Workshop + async | Workshop + async |
Outputdifferent | Forecast Percentiles, Throughput Dataset, Risk Communication | Behavior Over Time Graph, Trend Hypotheses, Key Events | Throughput Data, Flow Forecast, Slicing Rules | Iceberg Worksheet, Pattern Notes, Intervention Ideas |
Tagsno overlap | ForecastingFlowDelivery | Systems thinkingPatternsDynamics | EstimationForecastingFlow | Systems thinkingRoot causePatterns |