View methods side by side.
Choose up to four methods. Add them using the search and share the comparison by copying its link.
| Criterion |  Delivery Monte Carlo Forecasting | 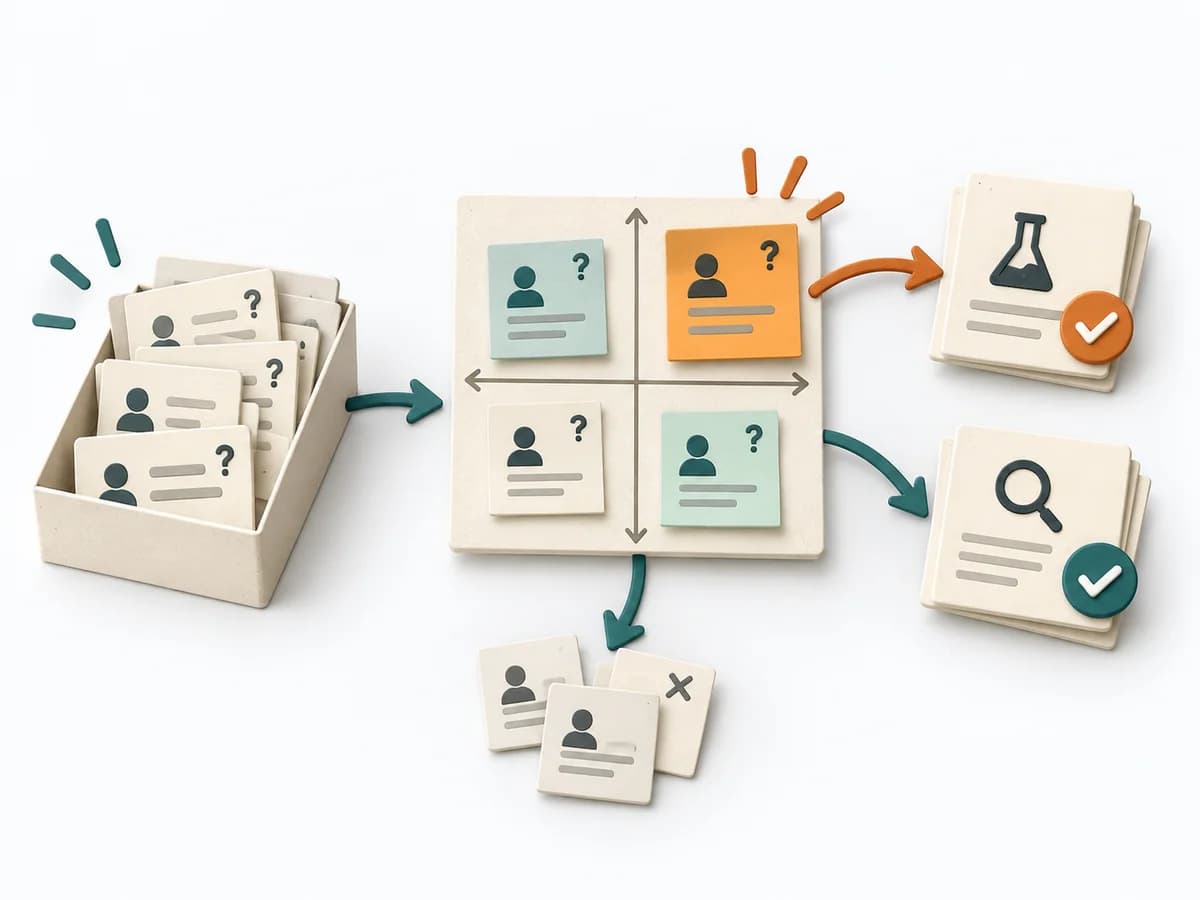 Decision Making Assumption Surfacing | 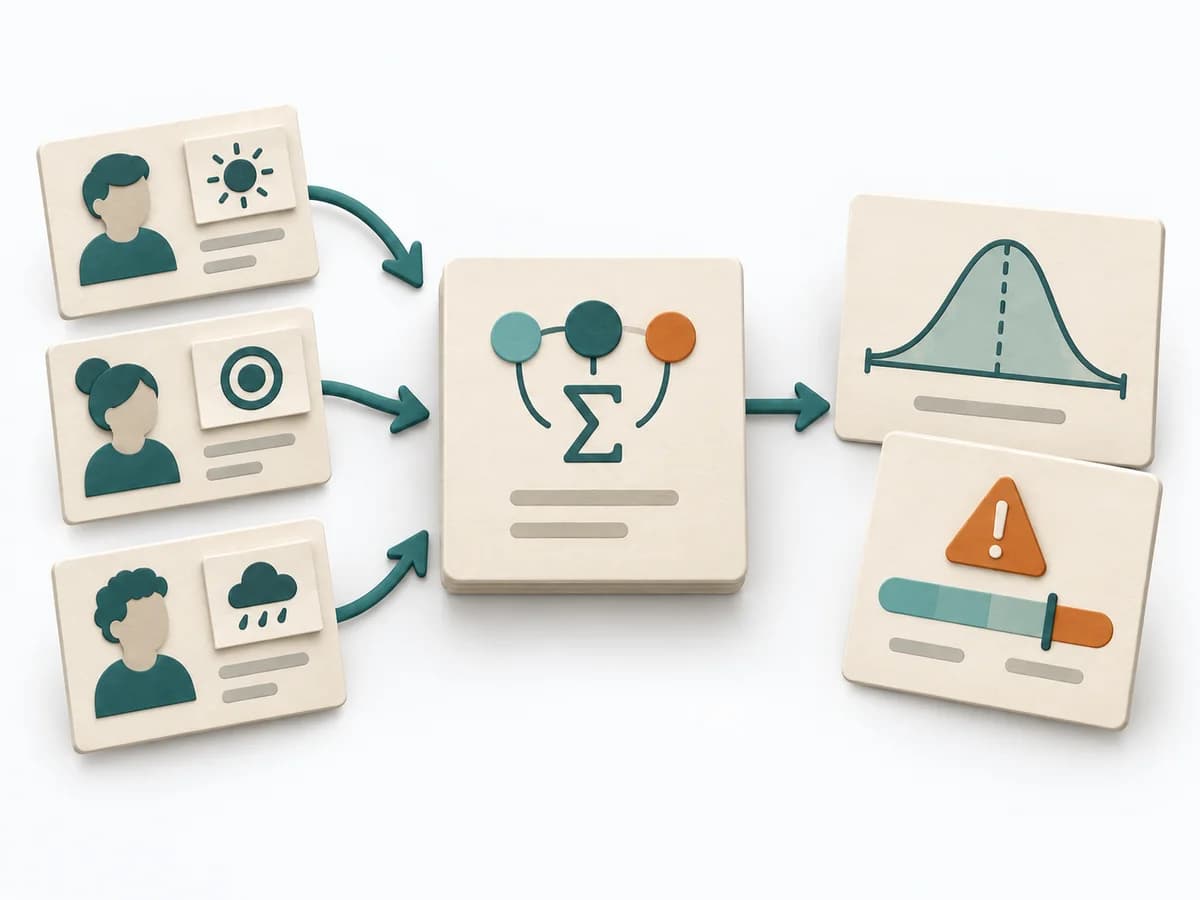 Decision Making PERT Estimation |  Product Discovery Assumption Mapping |
|---|---|---|---|---|
Purposedifferent | Helps clarify scope, sequence, and delivery flow in concrete terms. It makes work, boundaries, and order steerable. The result is captured as Forecast Percentiles, Throughput Dataset, and Risk Communication. | Plans often contain assumptions that were never openly stated and remain dangerous precisely because of that. Assumption Surfacing makes these silent premises visible and prioritizes which of them carry the initiative or could sink it. | On complex initiatives, a plain average tends to understate just how uncertain the outcome really is. It separates options, evaluation criteria, and open risks. The result is captured as a PERT Estimate, Expected Value, and Risk Notes. | When assumptions still sit unordered in the room, it weighs uncertainty against leverage. It makes visible which hypotheses should be checked first. |
Complexitydifferent | High | Low | Medium | Medium |
Timedifferent | 30-90 min Setup, danach laufend | 45-90 min | 15-45 min | 45-60 min |
Participantsdifferent | 1-8 | 2-8 | 1-8 | 2-8 |
Formatsame | Workshop + async | Workshop + async | Workshop + async | Workshop + async |
Outputdifferent | Forecast Percentiles, Throughput Dataset, Risk Communication | Assumption List, Critical Assumptions, Learning Plan | PERT Estimate, Expected Value, Risk Notes | Assumption map, Test backlog, Risk ranking |
Tagsno overlap | ForecastingFlowDelivery | AssumptionsRiskDecisionDiscovery | EstimationUncertaintyRisk | AssumptionsRiskExperimentsValidation |