View methods side by side.
Choose up to four methods. Add them using the search and share the comparison by copying its link.
Selected:Lean StartupARID (Active Reviews for Intermediate Designs)Behavior Over Time GraphCausal Loop Diagram
| Criterion | 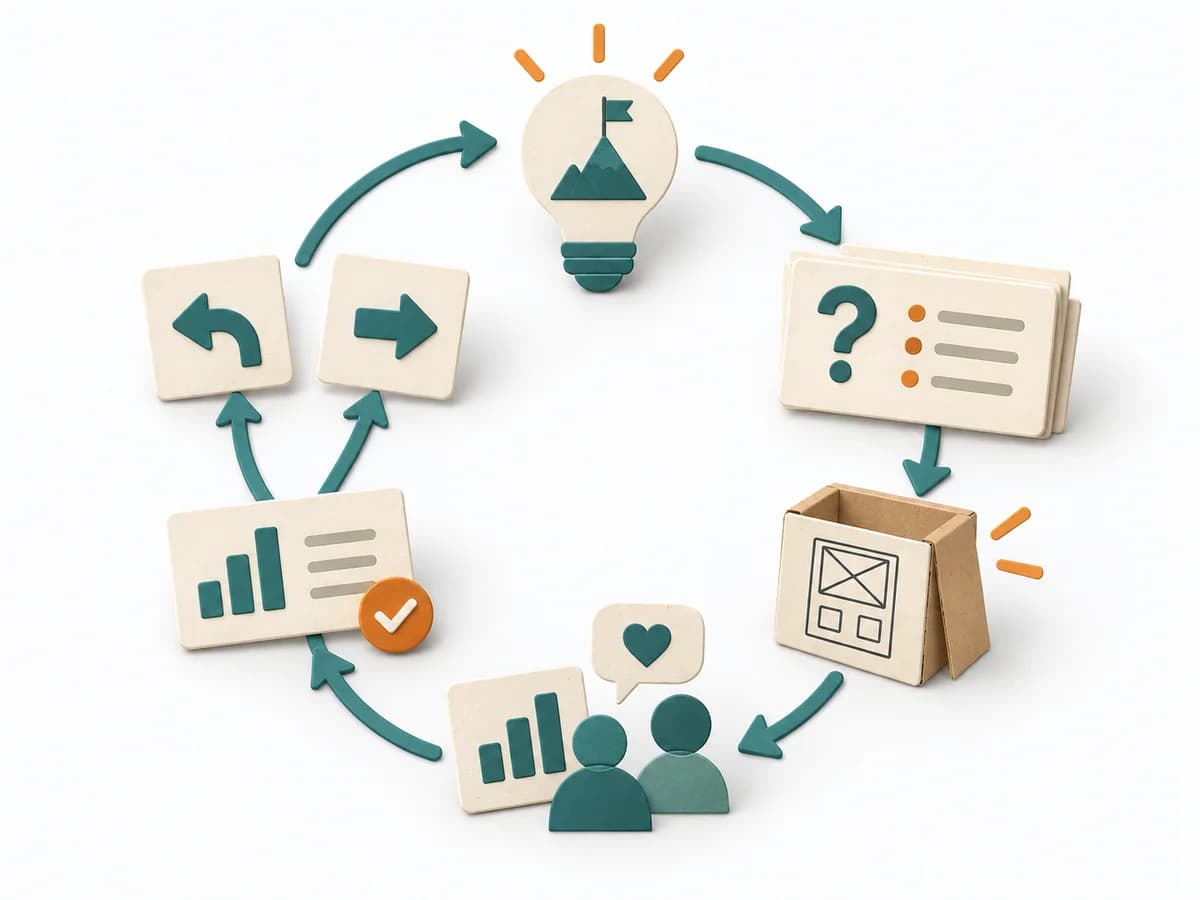 Innovation Lean Startup |  Architecture ARID (Active Reviews for Intermediate Designs) |  Systems Thinking Behavior Over Time Graph |  Systems Thinking Causal Loop Diagram |
|---|---|---|---|---|
Purposedifferent | For uncertain business assumptions, the method forces the idea into contact with real market reactions early. It separates wishful picture, assumption, and observable behavior, so that learning becomes faster than planning. This translates uncertainty into measurable insight. | ARID examines how well developers can work with a technical design. It focuses on a part of the system that can still be revised, between the architecture overview and the detailed specification. | A Behavior Over Time Graph shows how a metric or observation develops over time. The method makes trends, breaks, and recurring patterns visible that get lost in snapshots. | A Causal Loop Diagram makes feedback, reinforcement, and balance in a system legible. It uncovers side effects and self-reinforcement that stay hidden in linear explanations. |
Complexitydifferent | Medium | Medium | Low | Medium |
Timedifferent | Wochen bis Monate je Lernzyklus | 2–4 h review as a planning range; preparation and evaluation additional | 20-45 min | 1-3 h |
Participantsdifferent | 2-8 | Designers, developers as users, and facilitation | 1-10 | 2-8 |
Formatdifferent | Workshop + async | Workshop + async | Workshop + async | Workshop |
Outputdifferent | Hypothesis list, MVPs, Learning reports, Pivot or persevere decision | Prioritized development tasks, Jointly produced code or pseudocode, Observed difficulties and open design questions, Proposed design revisions | Behavior Over Time Graph, Trend Hypotheses, Key Events | Causal Loop Diagram, Feedback Notes, Leverage Points |
Tagsno overlap | LeanStartupValidationMVP | ArchitectureEngineeringFeedbackValidationTasks | Systems thinkingPatternsDynamics | FeedbackSystems thinkingCausalityDynamics |