View methods side by side.
Choose up to four methods. Add them using the search and share the comparison by copying its link.
| Criterion |  Product Strategy Lean Canvas | 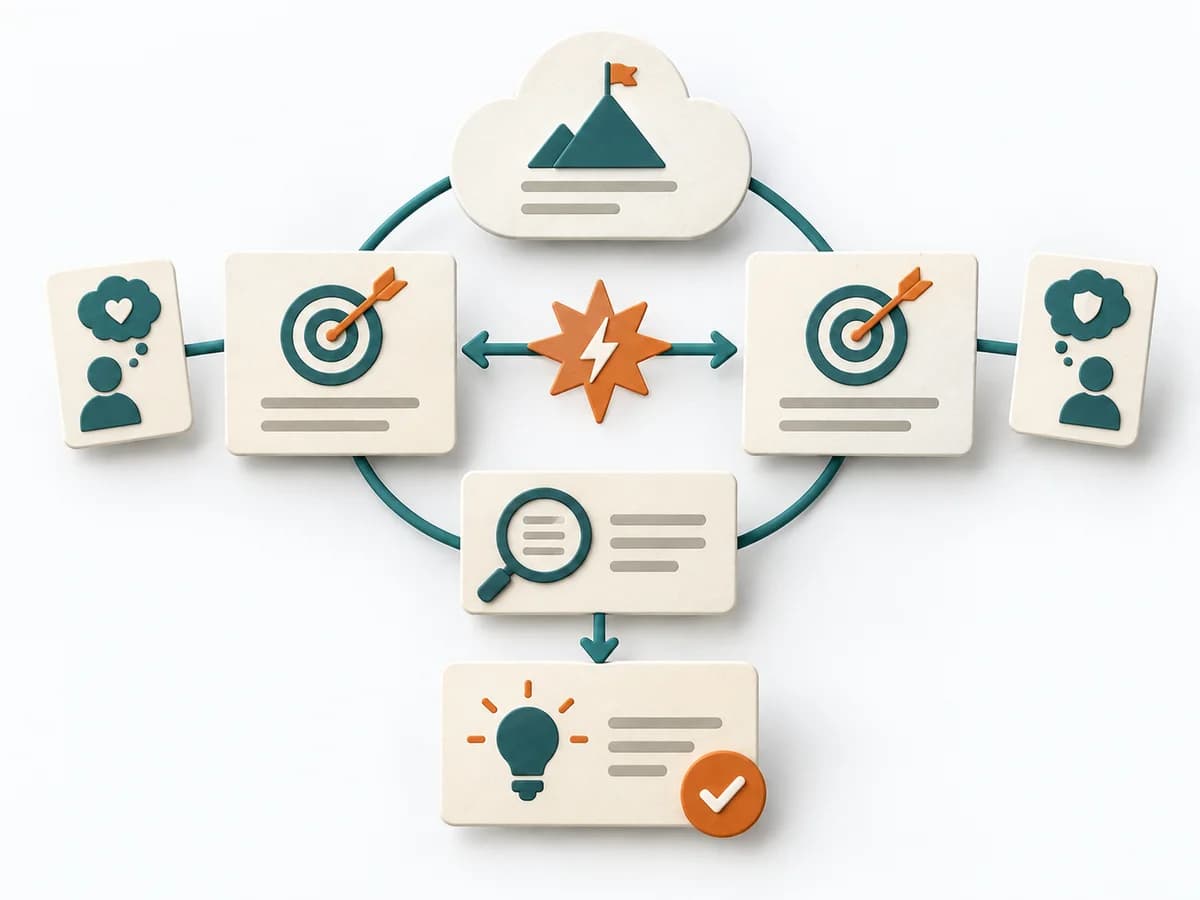 Systems Thinking Evaporating Cloud | 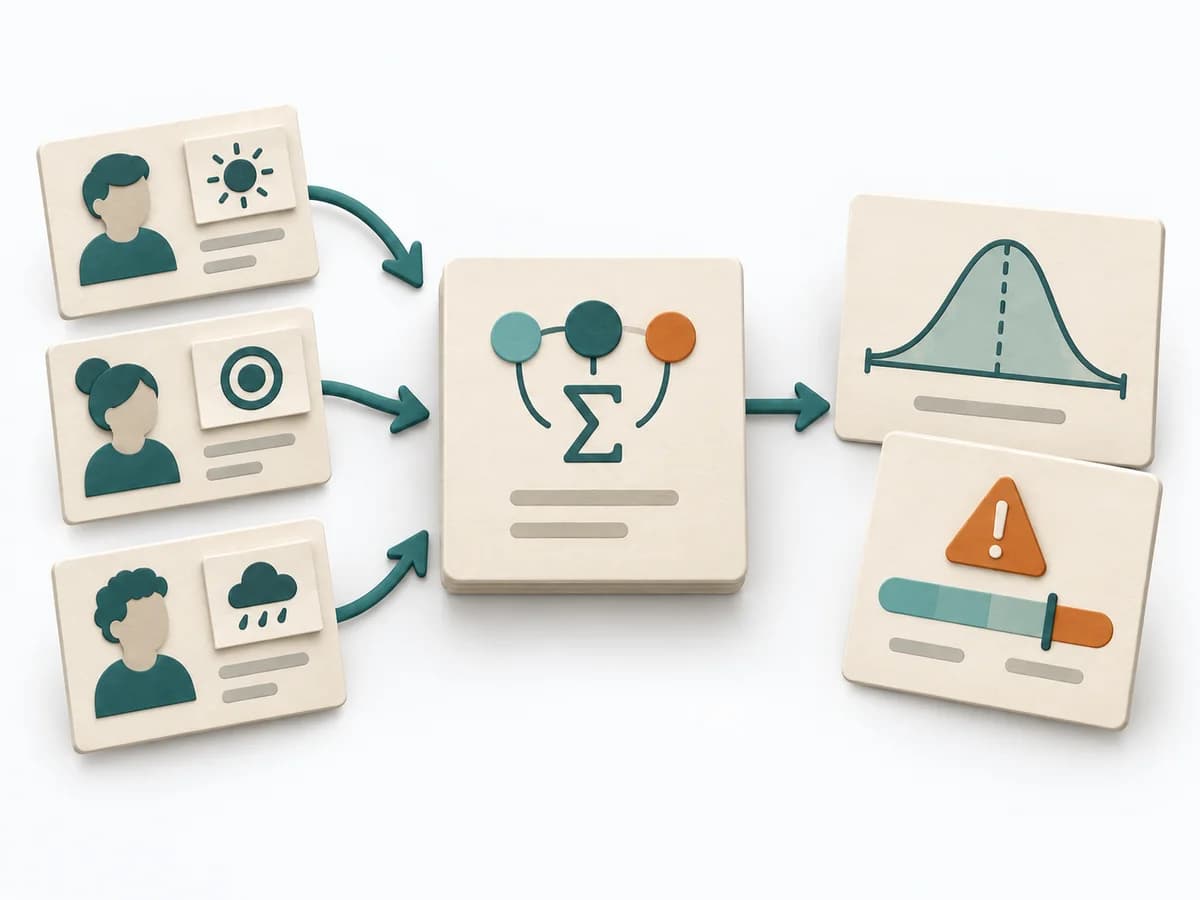 Decision Making PERT Estimation |  Facilitation Dot Estimation |
|---|---|---|---|---|
Purposedifferent | When an early product bet still has too many open points, it brings target group, problem, and assumptions into a single view. It condenses the idea so core risks become nameable. | The method makes visible why two seemingly incompatible demands arise and which assumption must be tested to resolve the conflict. | On complex initiatives, a plain average tends to understate just how uncertain the outcome really is. It separates options, evaluation criteria, and open risks. The result is captured as a PERT Estimate, Expected Value, and Risk Notes. | When size or effort can only be estimated roughly, Dot Estimation condenses the group's experience into a quick range. It turns individual contributions into a visible selection. The result is captured as an Effort Heatmap, Risk Signals, and Discussion Targets. |
Complexitydifferent | Medium | Medium | Medium | Low |
Timedifferent | 45-90 min | 60-120 min | 15-45 min | 5-20 min |
Participantsdifferent | 1-6 | 2-8 | 1-8 | 3-20 |
Formatdifferent | Workshop + async | Workshop | Workshop + async | Workshop |
Outputdifferent | Lean Canvas, Core Assumptions, Experiment Backlog | Conflict Cloud, Assumption List, Breakthrough Ideas, Next Experiments | PERT Estimate, Expected Value, Risk Notes | Effort Heatmap, Risk Signals, Discussion Targets |
Tagsno overlap | StartupLeanAssumptionsBusiness model | Theory of ConstraintsAssumptionsSystems thinking | EstimationUncertaintyRisk | EstimationEffortRisk |