View methods side by side.
Choose up to four methods. Add them using the search and share the comparison by copying its link.
| Criterion | 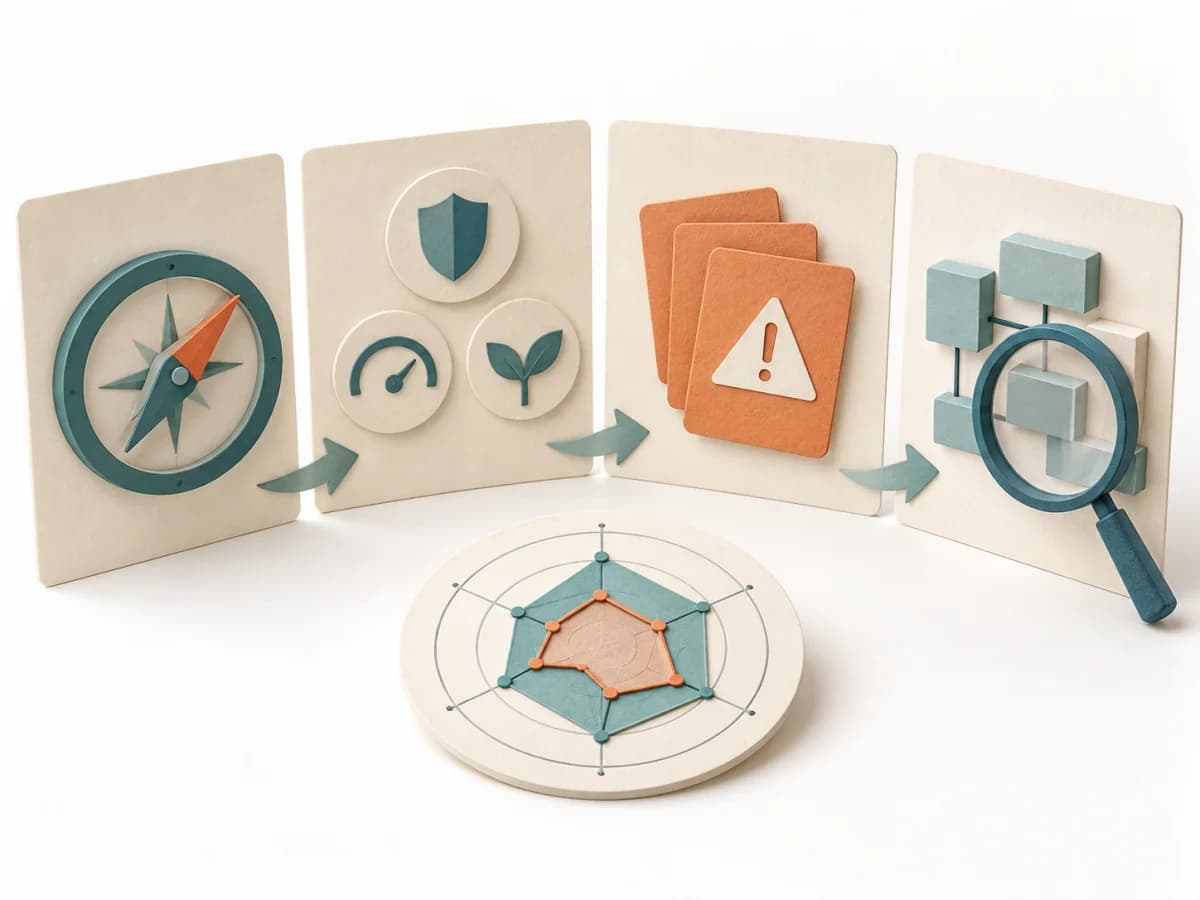 Architecture LASR (Lightweight Approach for Software Reviews) | 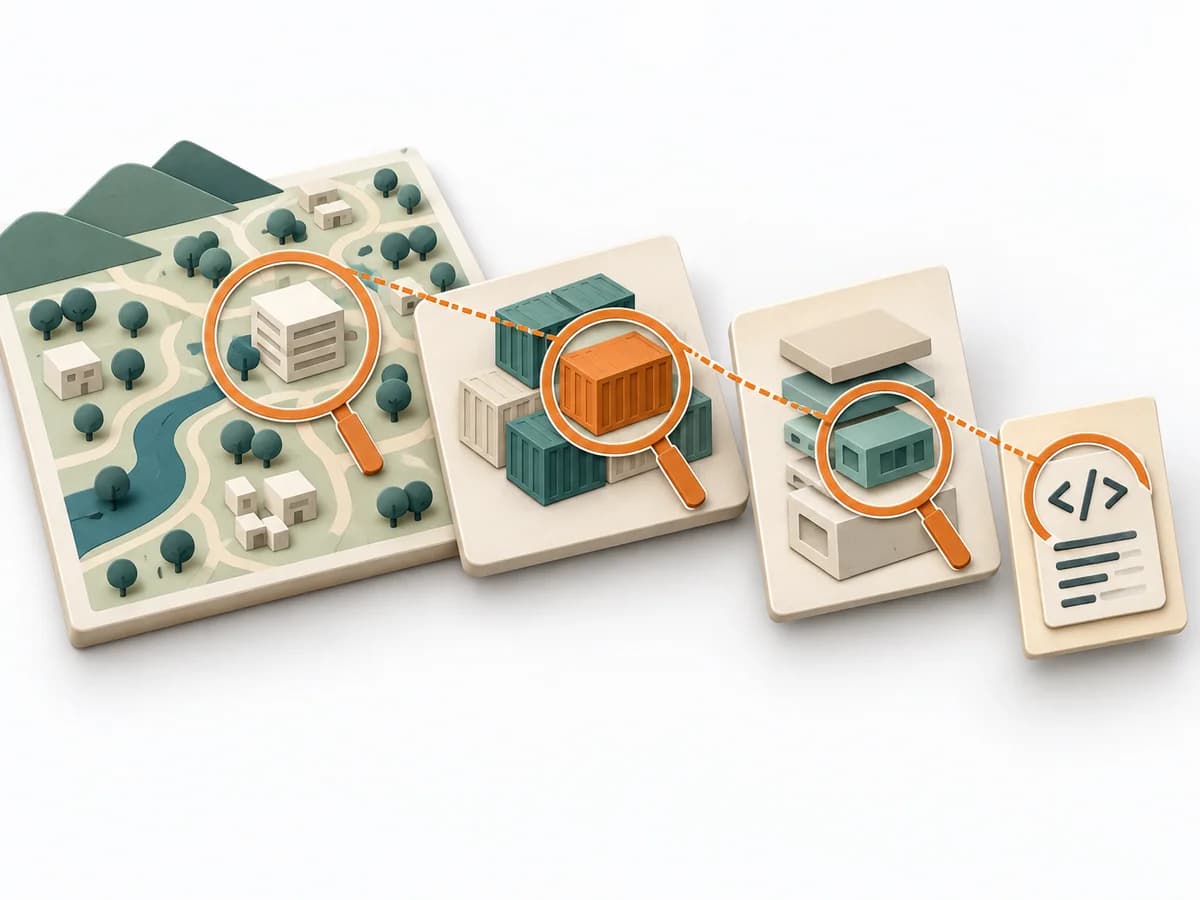 Architecture C4 Model |  Operations Scatter Diagram |  Operations 5 Whys |
|---|---|---|---|---|
Purposedifferent | LASR helps development teams identify where their software falls short of important quality goals and which improvements to consider. A small group with existing system knowledge can make an initial assessment and investigate open questions in more detail. | The C4 Model makes a system legible across several resolution levels, from context down to code. It suits situations where different audiences need to understand the same architecture from different altitudes. | When the question is whether two measures are related, the method makes patterns in the data picture visible. It separates felt correlations from relationships that actually show up in the data. | For a single, hard-to-explain deviation, the method exposes the causal chain behind the visible symptom. It keeps the cause open until a controllable condition emerges instead of a mere description. |
Complexitydifferent | Medium | Low | Low | Low |
Timedifferent | 3–4 h for initial assessment; preparation and deeper analysis additional | 1-4 h | 30-90 min | 15-30 min |
Participantsdifferent | 1 or a small team; particularly suitable for 3–4 people | 1-5 | 1-4 | 2-6 |
Formatdifferent | Workshop + async | Workshop + async | Workshop + async | Workshop |
Outputdifferent | Lean Mission Statement describing the software’s purpose, Prioritized quality goals and evaluation criteria, Risks and estimated gaps against quality goals, More closely examined findings and open checks | Context Diagram, Container Diagram, Component Diagram | Scatter Plot, Korrelationsnotiz, Hypothesenliste | Root cause notes, Countermeasures |
Tagsno overlap | ArchitectureQualityRiskAssessmentLean | ArchitectureCommunicationVisualization | Root causeQualityVisualization | Root causeIncidentLeanProblem solving |