View methods side by side.
Choose up to four methods. Add them using the search and share the comparison by copying its link.
| Criterion |  Product Strategy KPI Tree |  Product Strategy OKRs |  Decision Making OODA Loop | 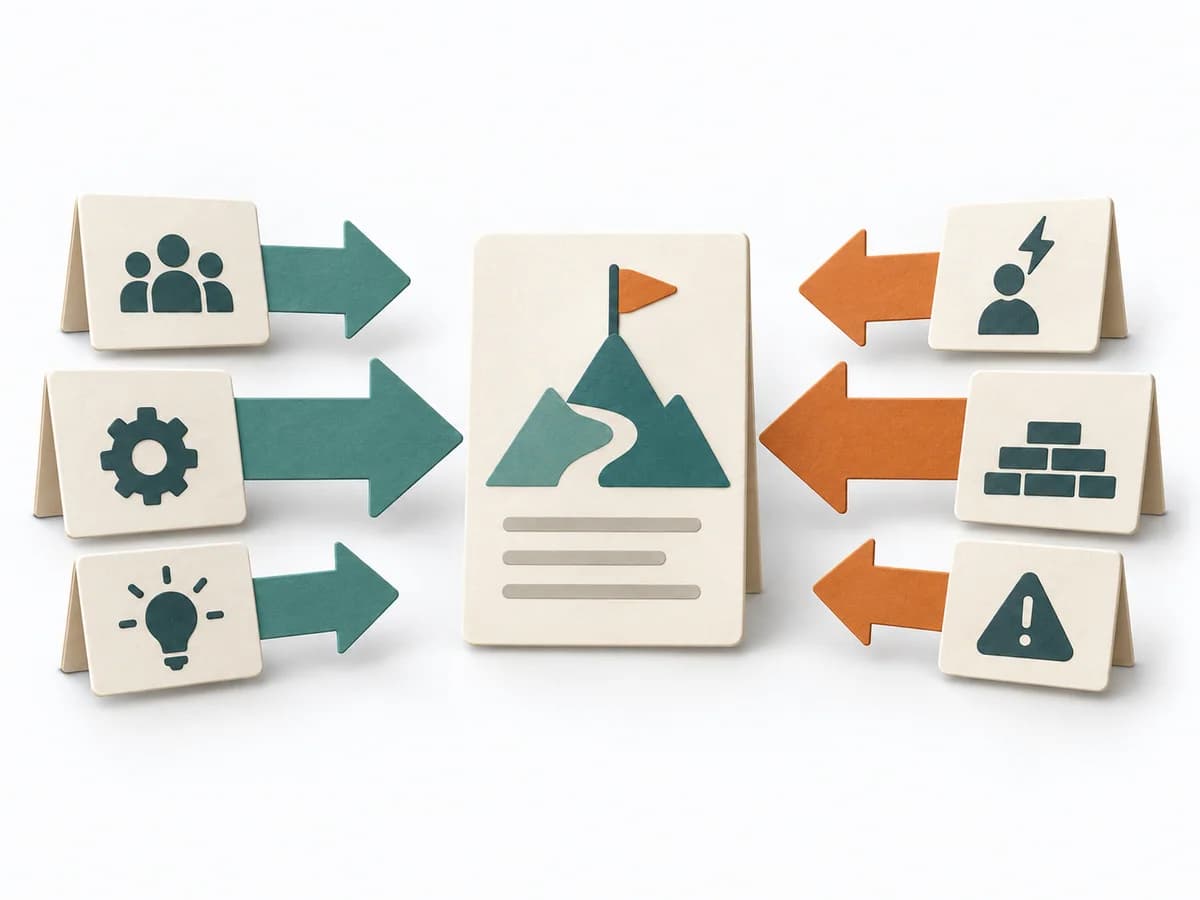 Decision Making Force Field Analysis |
|---|---|---|---|---|
Purposedifferent | When metrics across the organization drift apart, it arranges drivers and effects under one shared logic. It connects customer value, product logic, and decision priorities. The result is captured as a KPI tree and owner list. | When strategic direction needs to become measurable, it connects ambition with checkable results. It makes goals connectable to focus and review. | In dynamic situations, decisions become outdated faster than they can be prepared. The OODA Loop holds observing, orienting, deciding, and acting together as a recurring rhythm so reaction does not slide into inertia. | In change initiatives, supporting and restraining forces sit at the table at the same time. Force Field Analysis makes these tensions explicit and shows where change can be pushed forward by strengthening or relieving. |
Complexitydifferent | Medium | Medium | Medium | Low |
Timedifferent | 90-180 min initial, dann laufend | 1-2 h Setup | 15-60 min je Zyklus | 45-90 min |
Participantsdifferent | 3-8 | 2-20 | 1-8 | 3-12 |
Formatdifferent | Workshop + async | Workshop + async | Workshop + async | Workshop |
Outputdifferent | KPI Tree, Owner List | OKR set, Measurement plan, Review cadence | Situation Assessment, Decision Loop, Action Updates | Force Field Map, Change Levers, Risk Notes |
Tagsno overlap | MetricsStrategyAlignmentMeasurement | GoalsAlignmentOutcomesMeasurement | DecisionChangeLearningStrategy | ChangeDecisionStrategy |