View methods side by side.
Choose up to four methods. Add them using the search and share the comparison by copying its link.
| Criterion |  Product Strategy KPI Tree |  Facilitation Alignment Mapping | 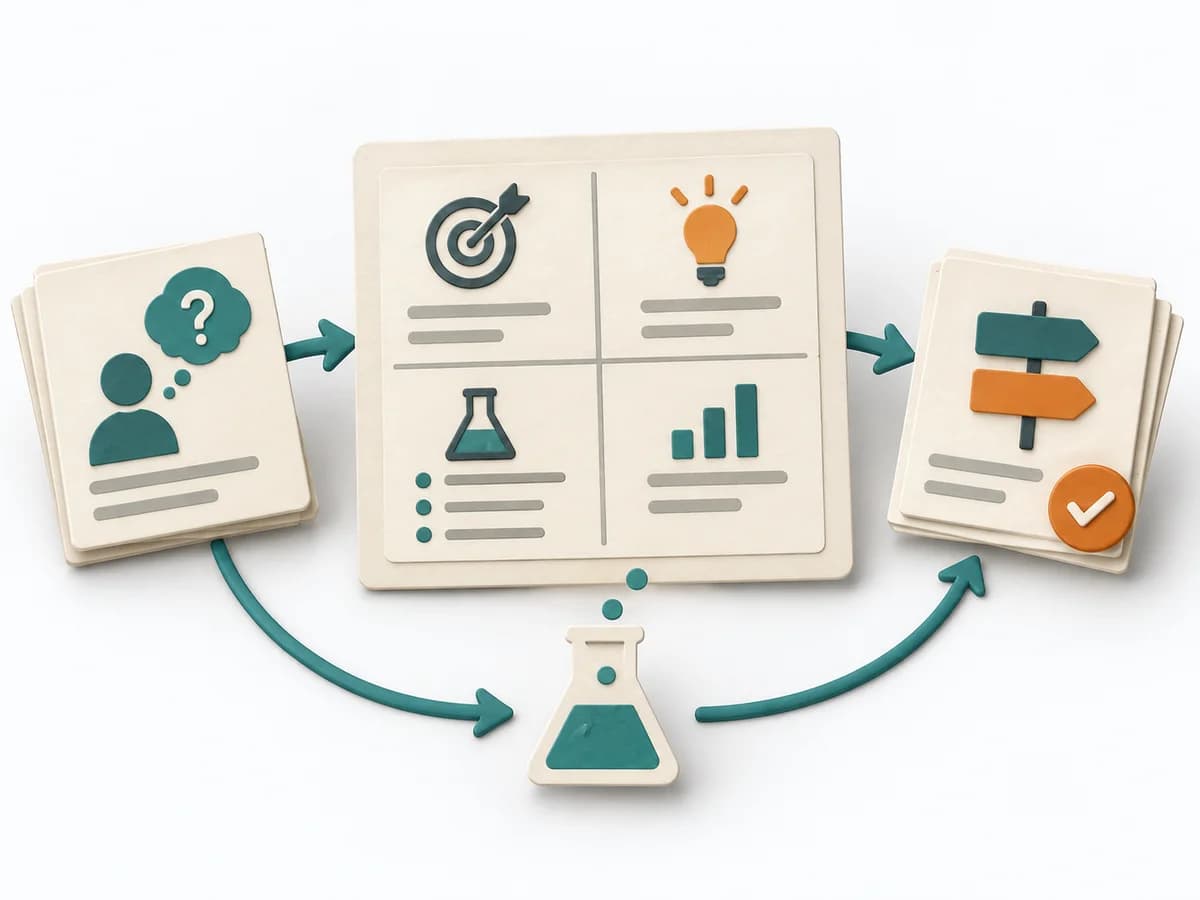 Product Discovery Experiment Canvas | 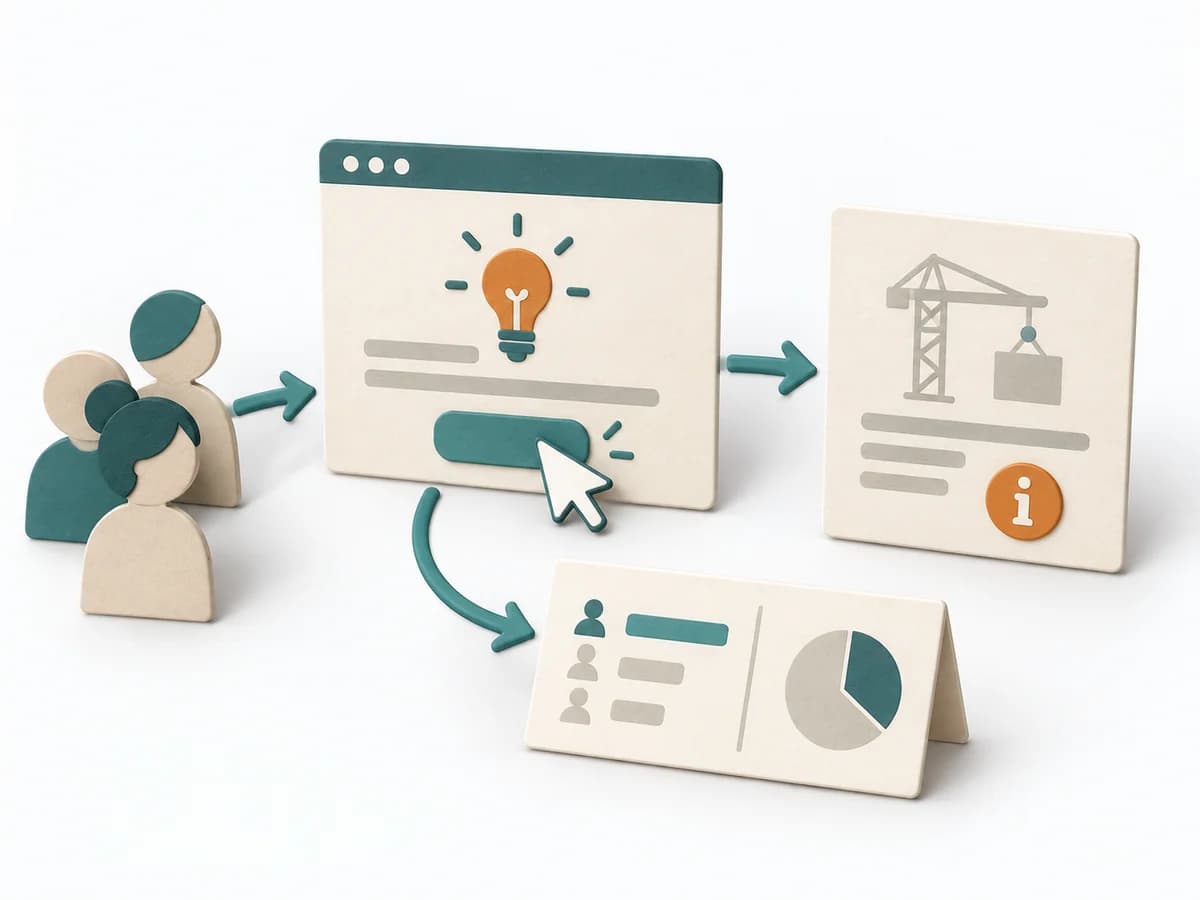 Product Discovery Fake Door Test |
|---|---|---|---|---|
Purposedifferent | When metrics across the organization drift apart, it arranges drivers and effects under one shared logic. It connects customer value, product logic, and decision priorities. The result is captured as a KPI tree and owner list. | When several people work toward one goal but hold different mental maps, Alignment Mapping makes the discrepancies visible. It arranges goals, assumptions, and priorities so shared direction becomes verifiable. | When experiments become unreadable after the fact, it arranges hypothesis, signal, and learning goal on a single canvas. It separates problem, assumption, solution, and evidence. The result is captured as a Completed Experiment Canvas and a Success Metric. | When demand is still unclear, it measures interest in a feature before it is built. It separates real behavior from polite agreement and deliberately keeps build effort small. |
Complexitydifferent | Medium | Medium | Low | Medium |
Timedifferent | 90-180 min initial, dann laufend | 1-2 h | 30-60 min | 1-5 Tage |
Participantsdifferent | 3-8 | 4-12 | 1-5 | Nutzertraffic |
Formatdifferent | Workshop + async | Workshop | Workshop + async | Async |
Outputdifferent | KPI Tree, Owner List | Alignment Map, Open Issues, Decision Questions | Completed Experiment Canvas, Success Metric | Click Data, Interest Signal, Learning Decision |
Tagsno overlap | MetricsStrategyAlignmentMeasurement | AlignmentStakeholdersStrategyFacilitation | ExperimentsValidationDiscoveryHypothesis | ValidationExperimentsDemandDiscovery |