View methods side by side.
Choose up to four methods. Add them using the search and share the comparison by copying its link.
| Criterion | 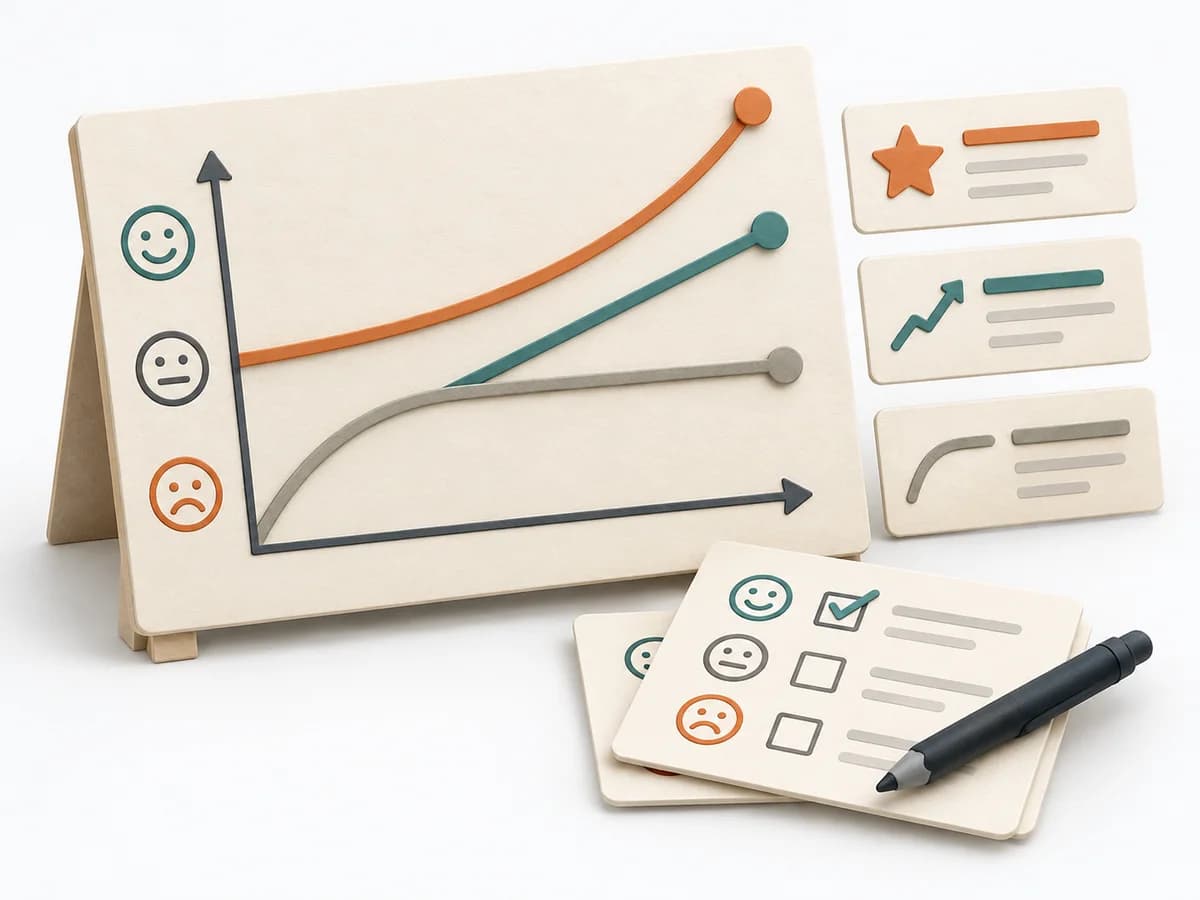 Product Discovery Kano Model |  UX Research Customer Journey Mapping | 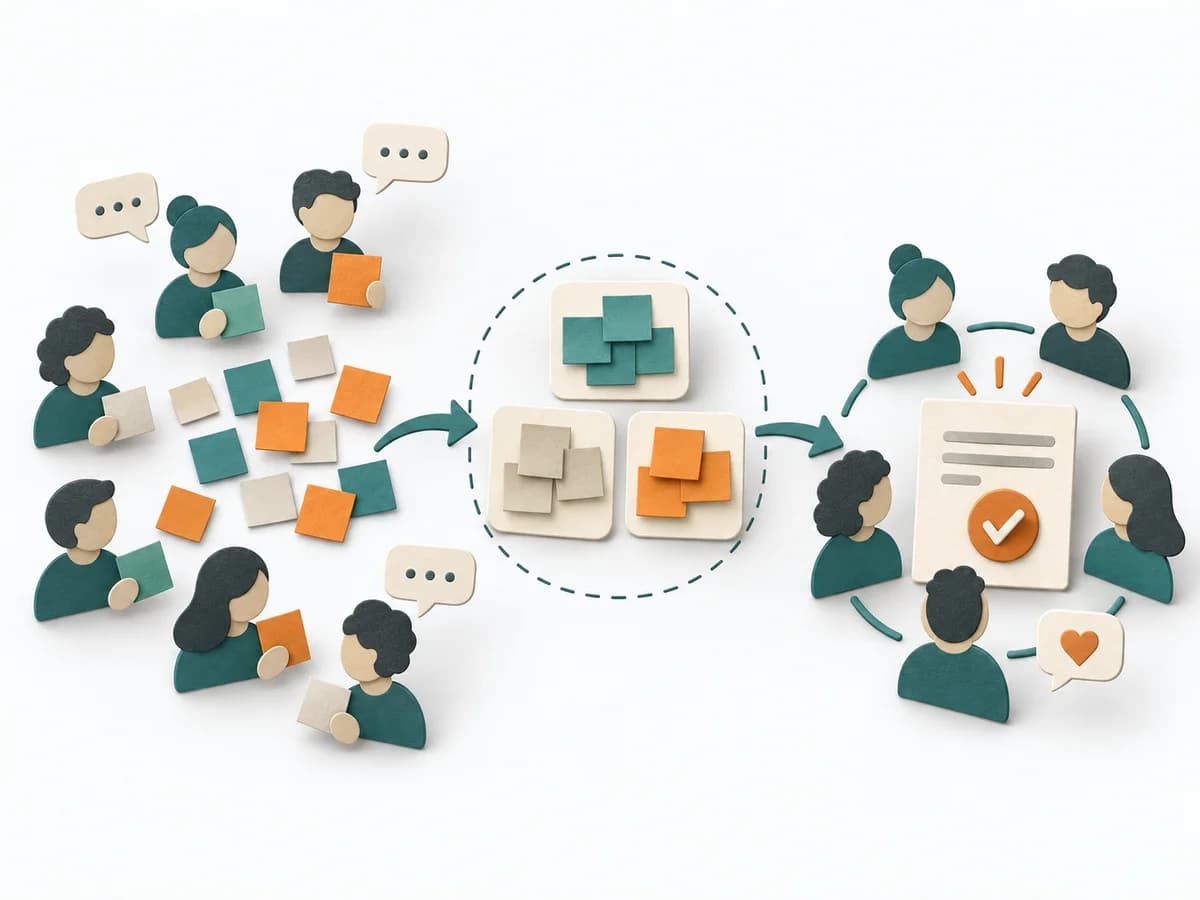 Facilitation Consensus Workshop |  Facilitation 3-Circle Venn Diagram |
|---|---|---|---|---|
Purposedifferent | When features need to be distinguished by their effect on satisfaction, it makes expectations and surprises comparable. It separates basic needs, performance contribution, and delight. | When a user journey falls apart across many touchpoints, customer journey mapping makes the experience visible as a coherent arc. Phases, emotions, and breaks become legible enough to prioritize critical moments deliberately. | When a group needs a solid decision without outvoting individual factions, a Consensus Workshop creates a negotiable common ground. It makes agreement, reservations, and open tensions discussable at the same time. | When three perspectives matter at the same time, a Three-Circle Venn Diagram shows the overlaps and remainders precisely. It makes visible where shared effect arises and where only a partial perspective applies. |
Complexitydifferent | Medium | Medium | Medium | Low |
Timedifferent | 1-2 Tage | 2-4 h | 1-3 h | 15-45 min |
Participantsdifferent | 10-50 | 4-10 | 5-30 | 2-8 |
Formatdifferent | Workshop + async | Workshop | Workshop | Workshop + async |
Outputdifferent | Kano Matrix, Feature Classes, Priority Themes | Journey Map, Pain-point List, Opportunity Backlog | Consensus Clusters, Theme Titles, Priority Areas | Venn Diagram, Overlap Notes, Differentiators |
Tagsno overlap | SatisfactionPrioritizationCustomer | JourneyServiceService design | FacilitationConsensusWorkshopAlignment | ComparisonFacilitationAlignment |