View methods side by side.
Choose up to four methods. Add them using the search and share the comparison by copying its link.
| Criterion |  DevOps Incident Timeline Analysis | 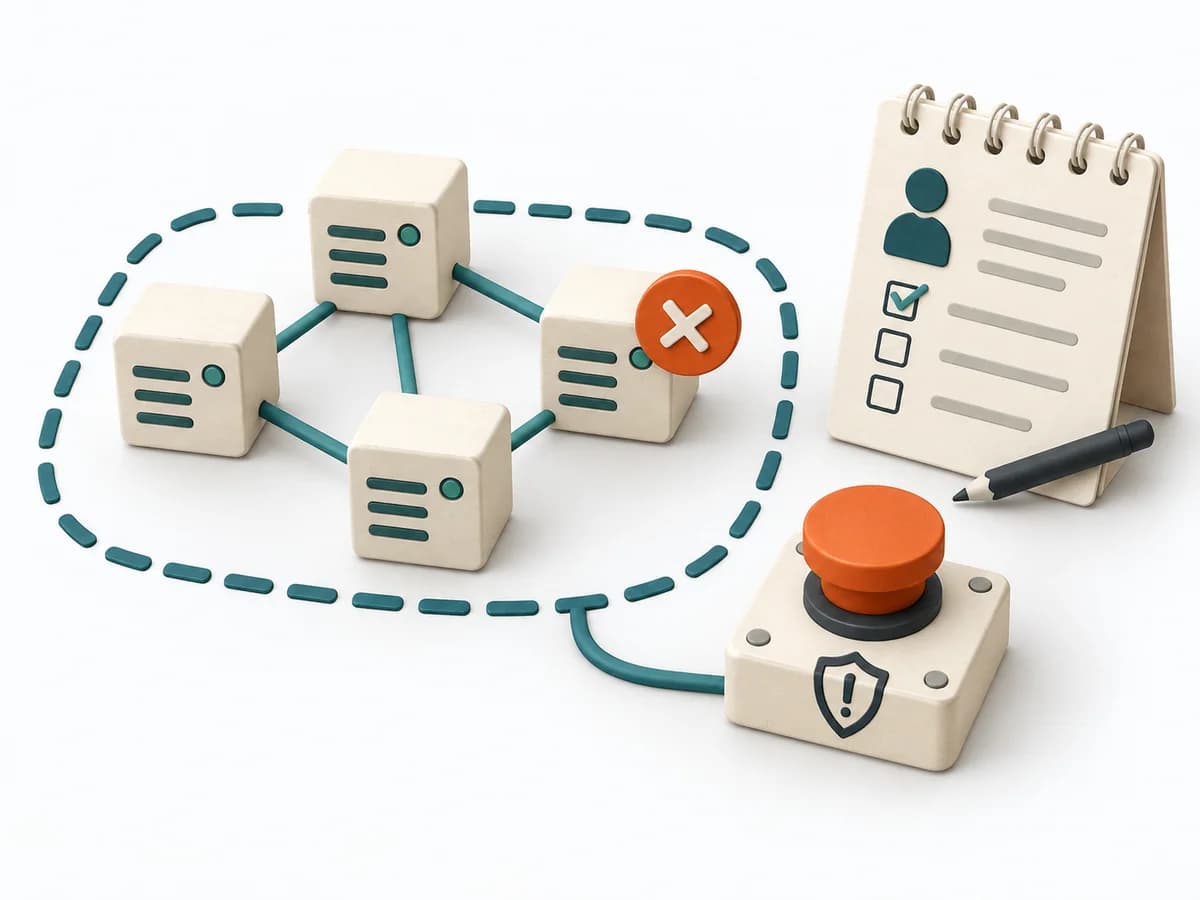 DevOps Game Day |  Facilitation Alignment Mapping |  Facilitation 3-Circle Venn Diagram |
|---|---|---|---|---|
Purposedifferent | For an incident with an unclear sequence, the method makes the timeline precisely visible. It separates perception, reaction, and delay so cause and effect become more clearly readable. | In preparing for rare incidents, the method tests response capability under controlled conditions. It shows where assumptions about stability, roles, and recovery are too optimistic. | When several people work toward one goal but hold different mental maps, Alignment Mapping makes the discrepancies visible. It arranges goals, assumptions, and priorities so shared direction becomes verifiable. | When three perspectives matter at the same time, a Three-Circle Venn Diagram shows the overlaps and remainders precisely. It makes visible where shared effect arises and where only a partial perspective applies. |
Complexitydifferent | Medium | High | Medium | Low |
Timedifferent | 60-180 min | Halber Tag | 1-2 h | 15-45 min |
Participantsdifferent | 3-10 | 5-20 | 4-12 | 2-8 |
Formatdifferent | Workshop + async | Workshop | Workshop | Workshop + async |
Outputdifferent | Incident Timeline, Evidence Log, Delay Analysis, Improvement Actions | Simulation Notes, Gaps List, Updated Runbooks | Alignment Map, Open Issues, Decision Questions | Venn Diagram, Overlap Notes, Differentiators |
Tagsno overlap | IncidentTimelineSite Reliability Engineering | ResilienceOperationsIncident | AlignmentStakeholdersStrategyFacilitation | ComparisonFacilitationAlignment |