View methods side by side.
Choose up to four methods. Add them using the search and share the comparison by copying its link.
| Criterion | 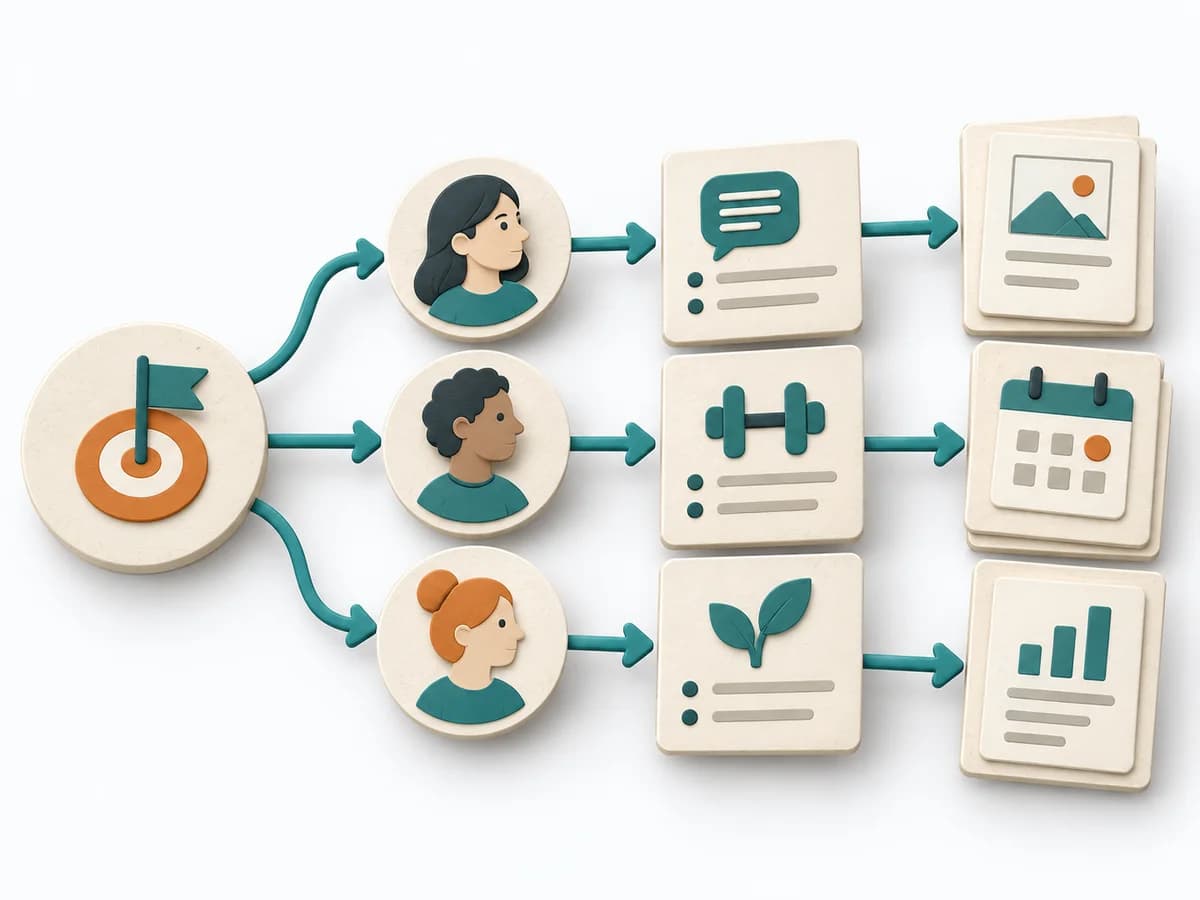 Product Strategy Impact Mapping | 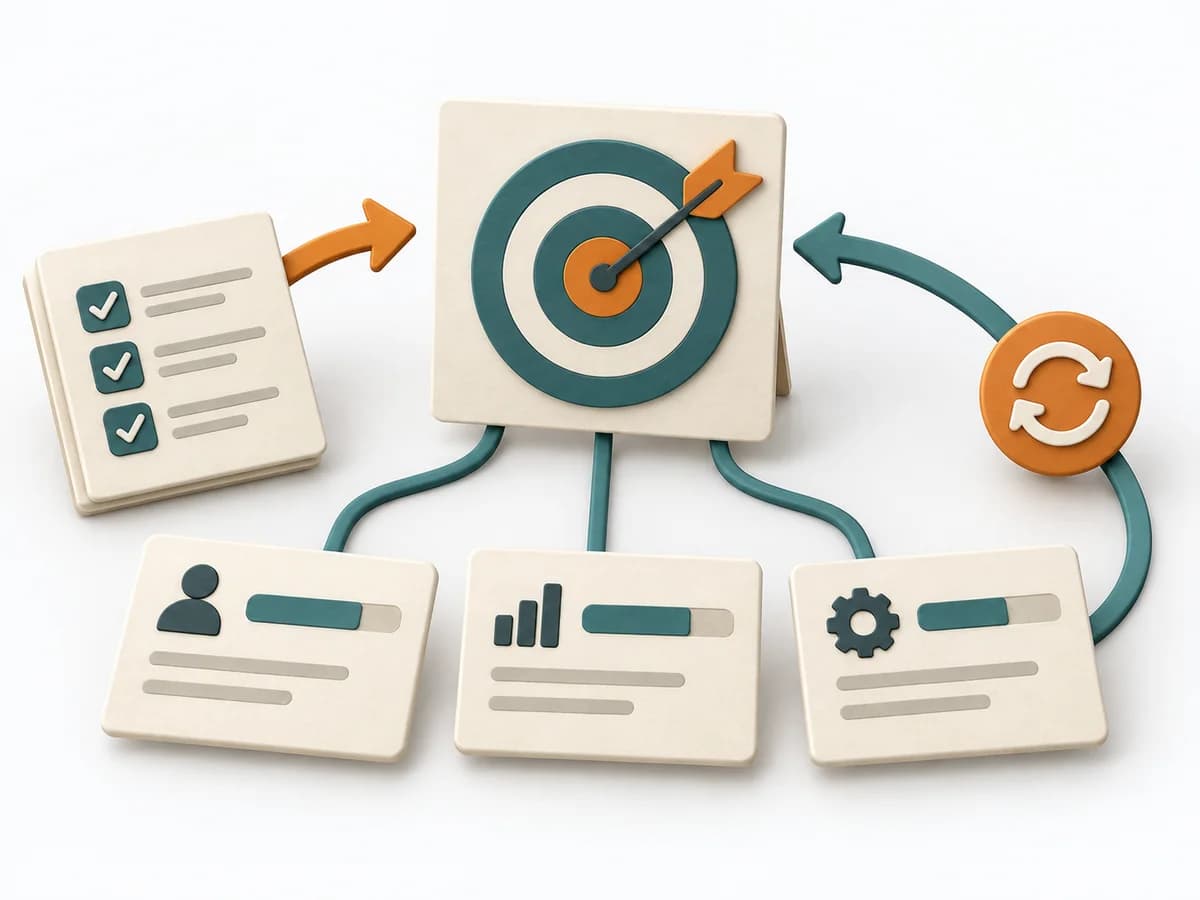 Product Strategy OKRs | 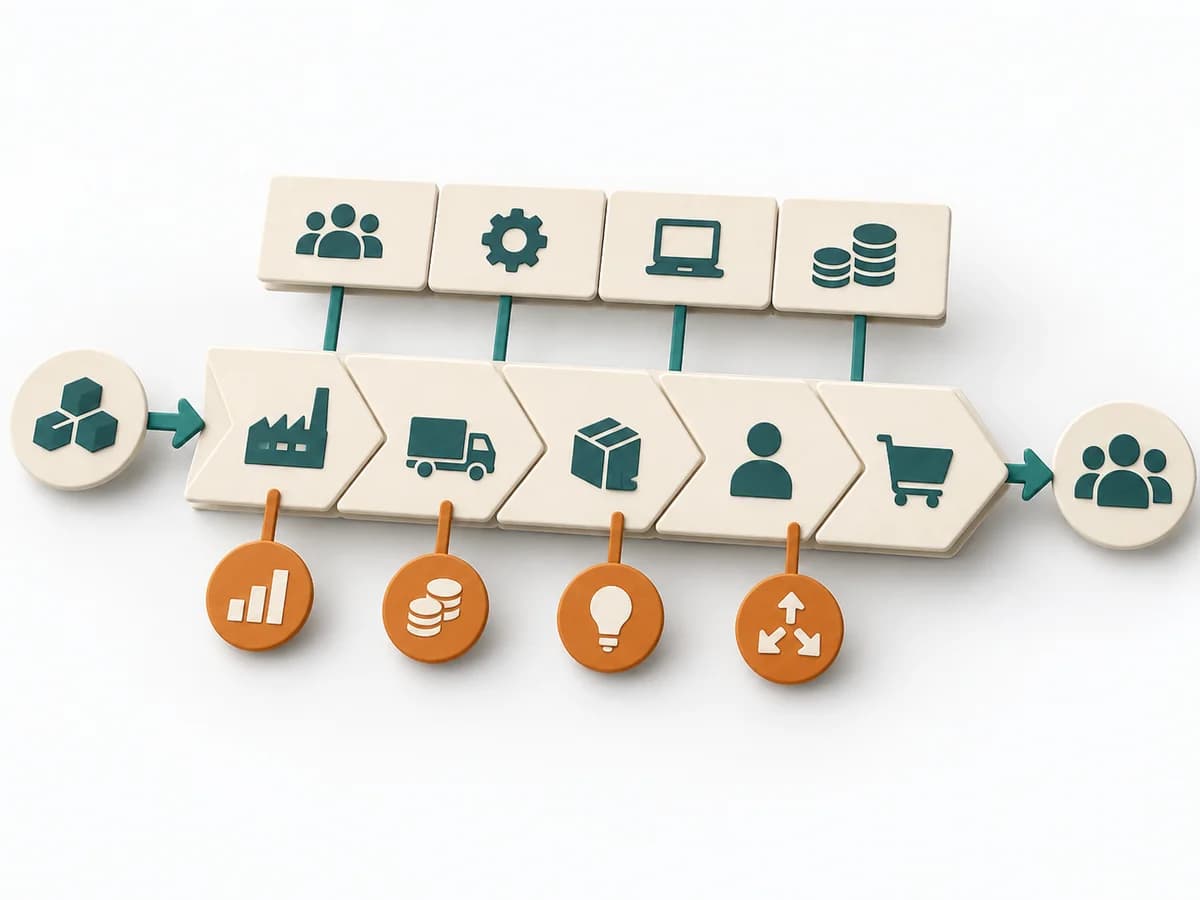 Business Strategy Value Chain Analysis |  Product Strategy KPI Tree |
|---|---|---|---|---|
Purposedifferent | When a goal needs to be connected to several possible paths, it shows chains of impact instead of feature lists. It connects business goal, behavior change, and measures. | When strategic direction needs to become measurable, it connects ambition with checkable results. It makes goals connectable to focus and review. | Value Chain Analysis shows where value is created, costs accrue, and differentiation becomes possible along the process. It compares strengths, risks, market logic, and courses of action. The result is captured as a value-chain map and lever list. | When metrics across the organization drift apart, it arranges drivers and effects under one shared logic. It connects customer value, product logic, and decision priorities. The result is captured as a KPI tree and owner list. |
Complexitydifferent | Medium | Medium | High | Medium |
Timedifferent | 45-90 min | 1-2 h Setup | Half day | 90-180 min initial, dann laufend |
Participantsdifferent | 3-8 | 2-20 | 3-8 | 3-8 |
Formatdifferent | Workshop | Workshop + async | Workshop | Workshop + async |
Outputdifferent | Impact Map, Outcome Hypotheses, Delivery Options | OKR set, Measurement plan, Review cadence | Value Chain Map, Lever List | KPI Tree, Owner List |
Tagsno overlap | OutcomesStrategyBehaviorPlanning | GoalsAlignmentOutcomesMeasurement | StrategyBusiness modelDiagnosisAnalysis | MetricsStrategyAlignmentMeasurement |