View methods side by side.
Choose up to four methods. Add them using the search and share the comparison by copying its link.
| Criterion |  Product Strategy ICE Scoring |  Operations Change Analysis | 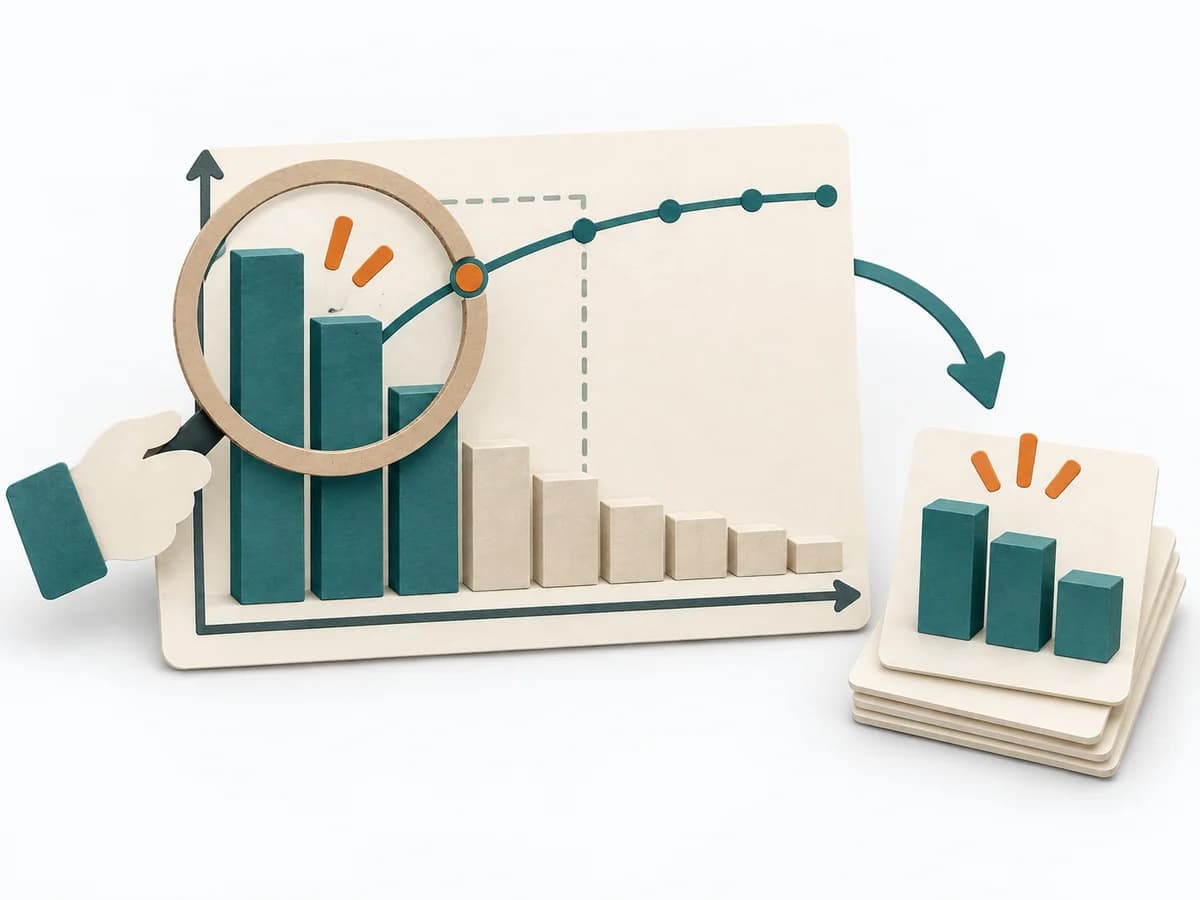 Decision Making Pareto Analysis |  Delivery Cost of Delay |
|---|---|---|---|---|
Purposedifferent | When ideas need sorting quickly, it condenses impact, confidence, and effort into one compact score. It connects customer value, product logic, and decision priorities. The result is captured as an ICE table and top-ideas list. | For a deviation after a change, the method isolates the influence of the altered condition. It narrows down which differences are relevant and which are just accompanying noise. | In many problem situations, effect is distributed unequally across many causes. A Pareto Analysis separates the few drivers with high leverage from the long remainder and focuses attention on what measurably moves the needle. | Helps clarify scope, order, and delivery flow in concrete terms. It makes work, constraints, and sequence manageable. The result is captured as a Cost of Delay table and prioritization sequence. |
Complexitydifferent | Low | Medium | Low | High |
Timedifferent | 30-60 min | 45-120 min | 30-60 min | 90-180 min |
Participantsdifferent | 2-8 | 2-6 | 1-6 | 3-8 |
Formatdifferent | Workshop + async | Workshop + async | Workshop + async | Workshop |
Outputdifferent | ICE Table, Top Idea List | Change Matrix, Cause Hypotheses, Validation Questions, Action List | Pareto Chart, Top Causes, Focus List | CoD Table, Prioritization Sequence |
Tagsno overlap | PrioritizationScoringGrowthDecision | ChangeRoot causeTroubleshootingComparison | PrioritizationQualityFocusRoot cause | PrioritizationDeliveryEconomicsDecision |