View methods side by side.
Choose up to four methods. Add them using the search and share the comparison by copying its link.
| Criterion | 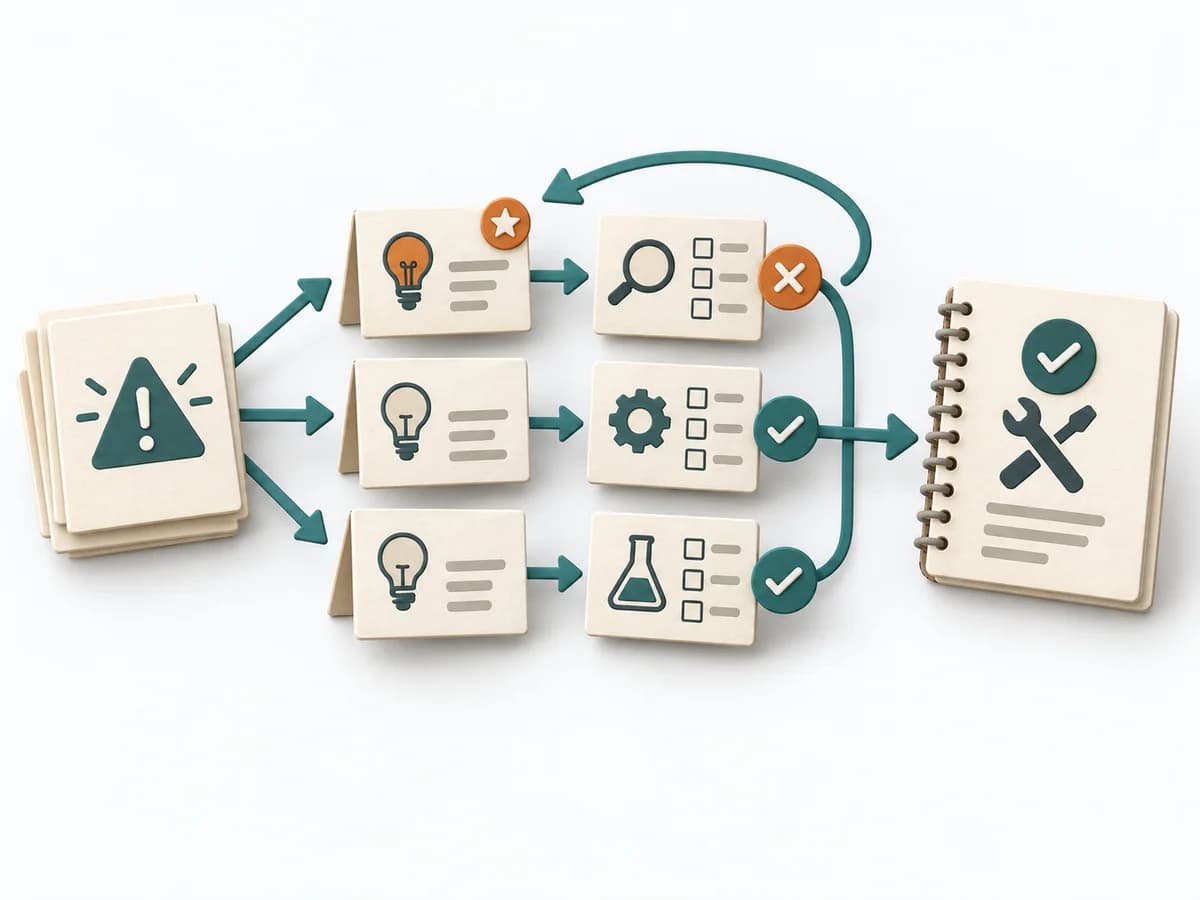 Engineering Hypothesis-Driven Troubleshooting |  Operations Scatter Diagram |  Operations Change Analysis |  Operations 8D Problem Solving |
|---|---|---|---|---|
Purposedifferent | When systems fail unexpectedly, spontaneous attempts often produce more noise than insight. Hypothesis-driven Troubleshooting translates symptoms into testable assumptions and makes troubleshooting learnable. | When the question is whether two measures are related, the method makes patterns in the data picture visible. It separates felt correlations from relationships that actually show up in the data. | For a deviation after a change, the method isolates the influence of the altered condition. It narrows down which differences are relevant and which are just accompanying noise. | For an acute quality or delivery problem, the method structures immediate protection and root cause work together. It keeps the situation stable while the actual cause is investigated cleanly. |
Complexitydifferent | Medium | Low | Medium | High |
Timedifferent | 30-240 min | 30-90 min | 45-120 min | 1-6 Wochen |
Participantsdifferent | 1-6 | 1-4 | 2-6 | 4-10 |
Formatsame | Workshop + async | Workshop + async | Workshop + async | Workshop + async |
Outputdifferent | Hypothesis Log, Test Plan, Evidence Notes, Diagnosis Summary | Scatter Plot, Korrelationsnotiz, Hypothesenliste | Change Matrix, Cause Hypotheses, Validation Questions, Action List | 8D Report, Containment Plan, Root Cause Evidence, Corrective Action Plan |
Tagsno overlap | TroubleshootingProblem solvingDiagnosis | Root causeQualityVisualization | ChangeRoot causeTroubleshootingComparison | QualityProblem solvingRoot cause |