View methods side by side.
Choose up to four methods. Add them using the search and share the comparison by copying its link.
| Criterion |  Business Strategy GAP Analysis | 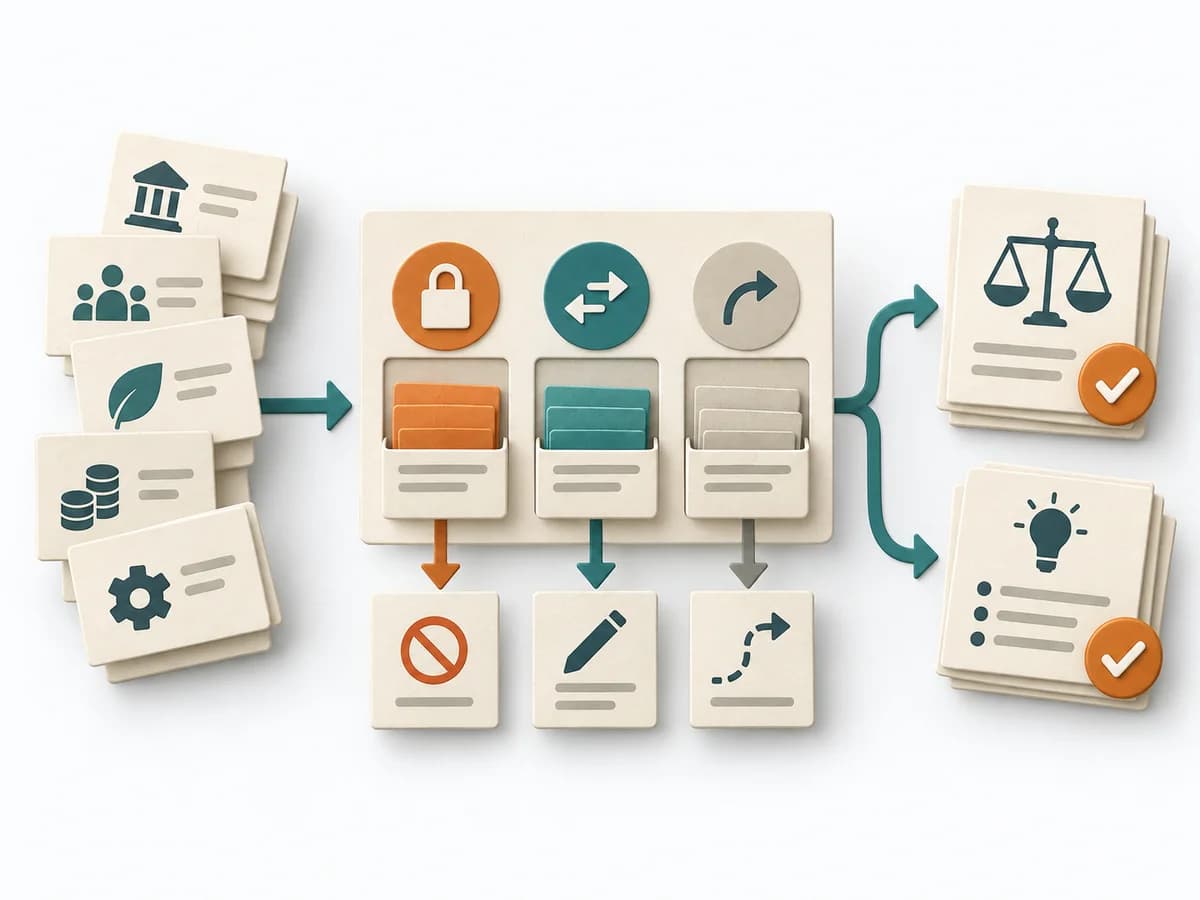 Decision Making Constraint Analysis |  Systems Thinking Wardley Mapping |  Systems Thinking Causal Loop Diagram |
|---|---|---|---|---|
Purposedifferent | GAP Analysis compares the current state with a target picture and makes the distance manageable. It becomes useful when, ahead of new initiatives, it must become clear which capabilities, processes, or resources are missing. | When an initiative stalls, the limit often lies not in the idea but in hard or soft boundary conditions. Constraint Analysis separates these limits and shows which of them can actually be shaped. | Wardley Mapping makes visible where an offering stands today and where it can evolve. The method connects user need, value chain, and evolution stages into a strategic basis for platform, build, or buy decisions. | A Causal Loop Diagram makes feedback, reinforcement, and balance in a system legible. It uncovers side effects and self-reinforcement that stay hidden in linear explanations. |
Complexitydifferent | Medium | Low | Medium | Medium |
Timedifferent | 1-3 h | 30-90 min | 1-3 h | 1-3 h |
Participantsdifferent | 2-8 | 2-8 | 2-10 | 2-8 |
Formatdifferent | Workshop + async | Workshop + async | Workshop + async | Workshop |
Outputdifferent | Gap Matrix, Action Plan, Risk Notes | Constraint List, Hard/Soft Classification, Option Impact Notes, Decision Boundaries | Wardley Map, Strategic Options, Evolution Notes | Causal Loop Diagram, Feedback Notes, Leverage Points |
Tagsno overlap | StrategyAnalysisPlanning | ConstraintsDecisionPlanningOptions | StrategySystems thinkingDynamics | FeedbackSystems thinkingCausalityDynamics |